Long Post – Goldbugs Gots The Fever Again?
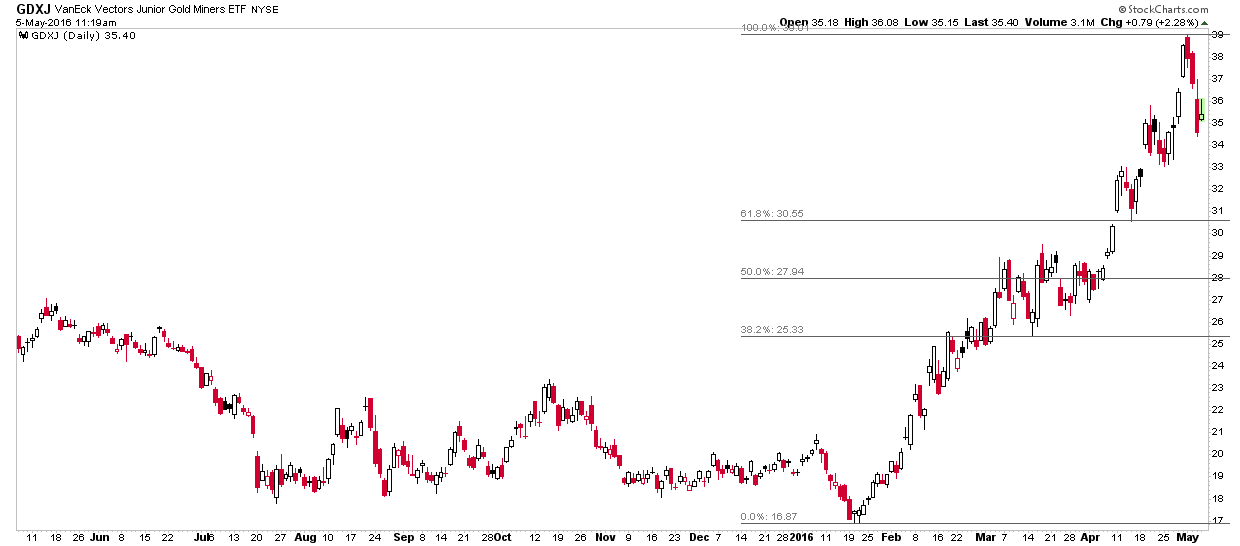
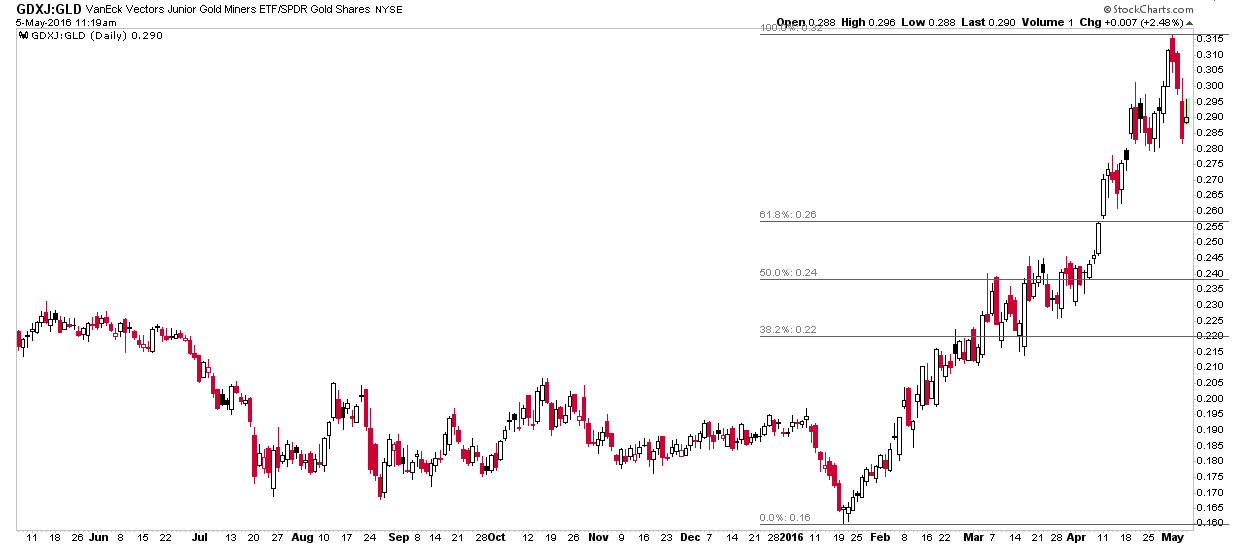
I think the GLD, GDXJ & GDXJGR (GDXJ-GLD ratio), daily charts tell a story of gold fever in the junior miners during April:


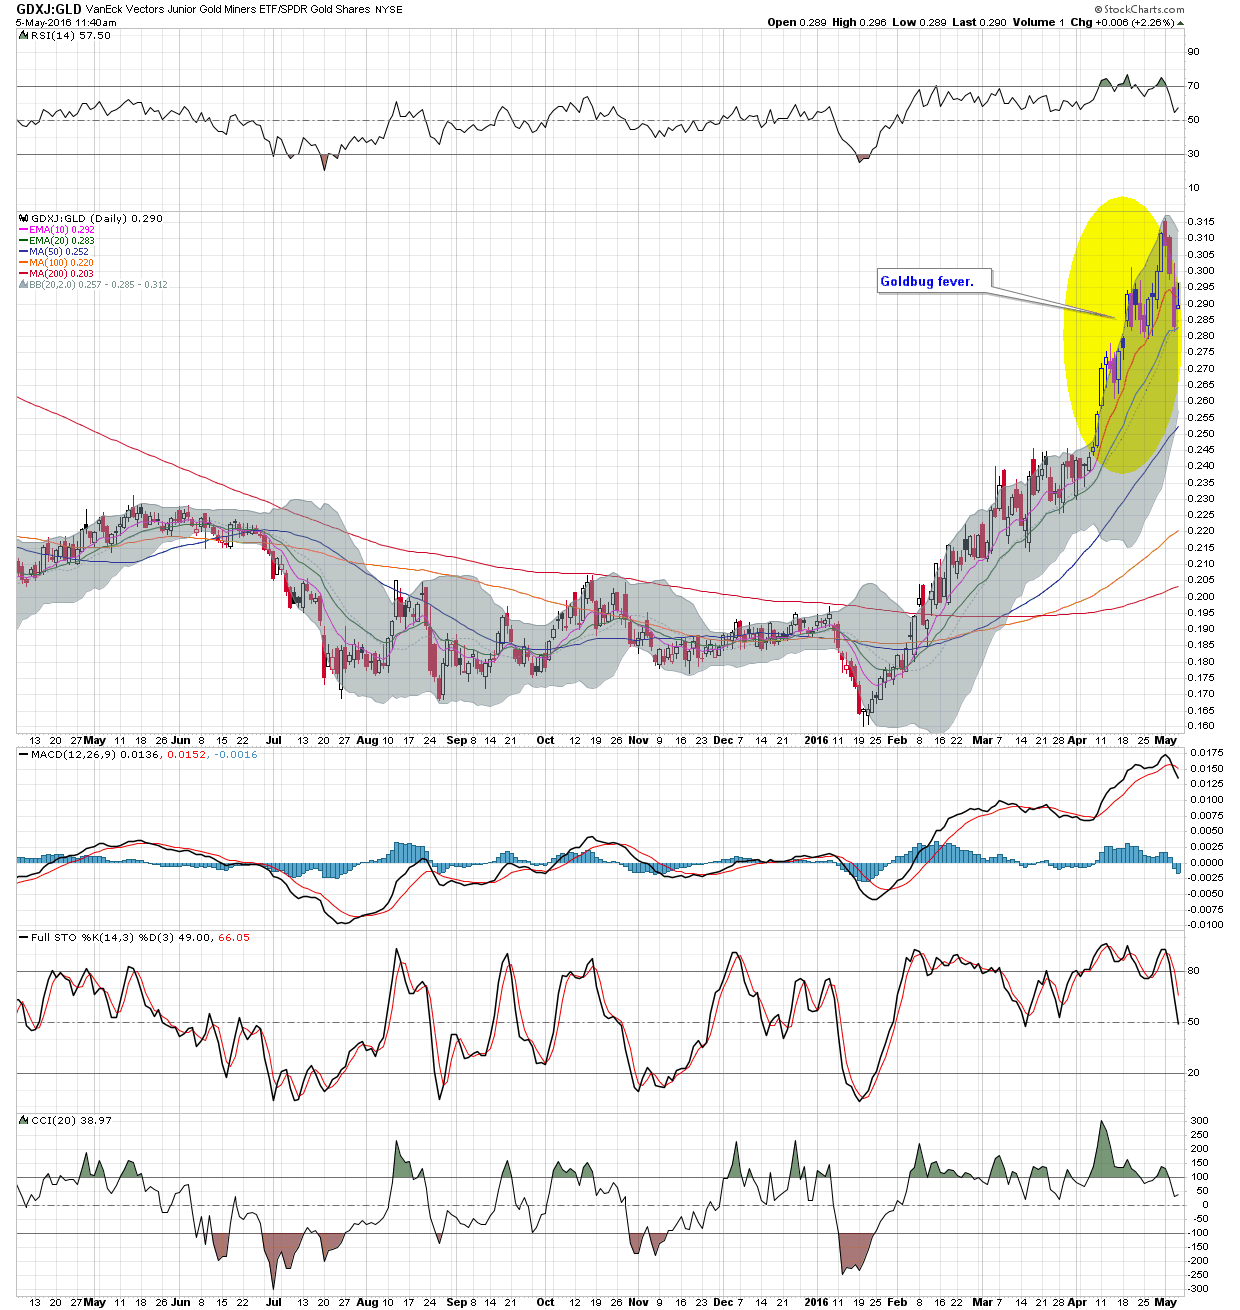
Gold didn’t rise much but GDXJ rocketed anyway, as confirmed by GDXJGR.
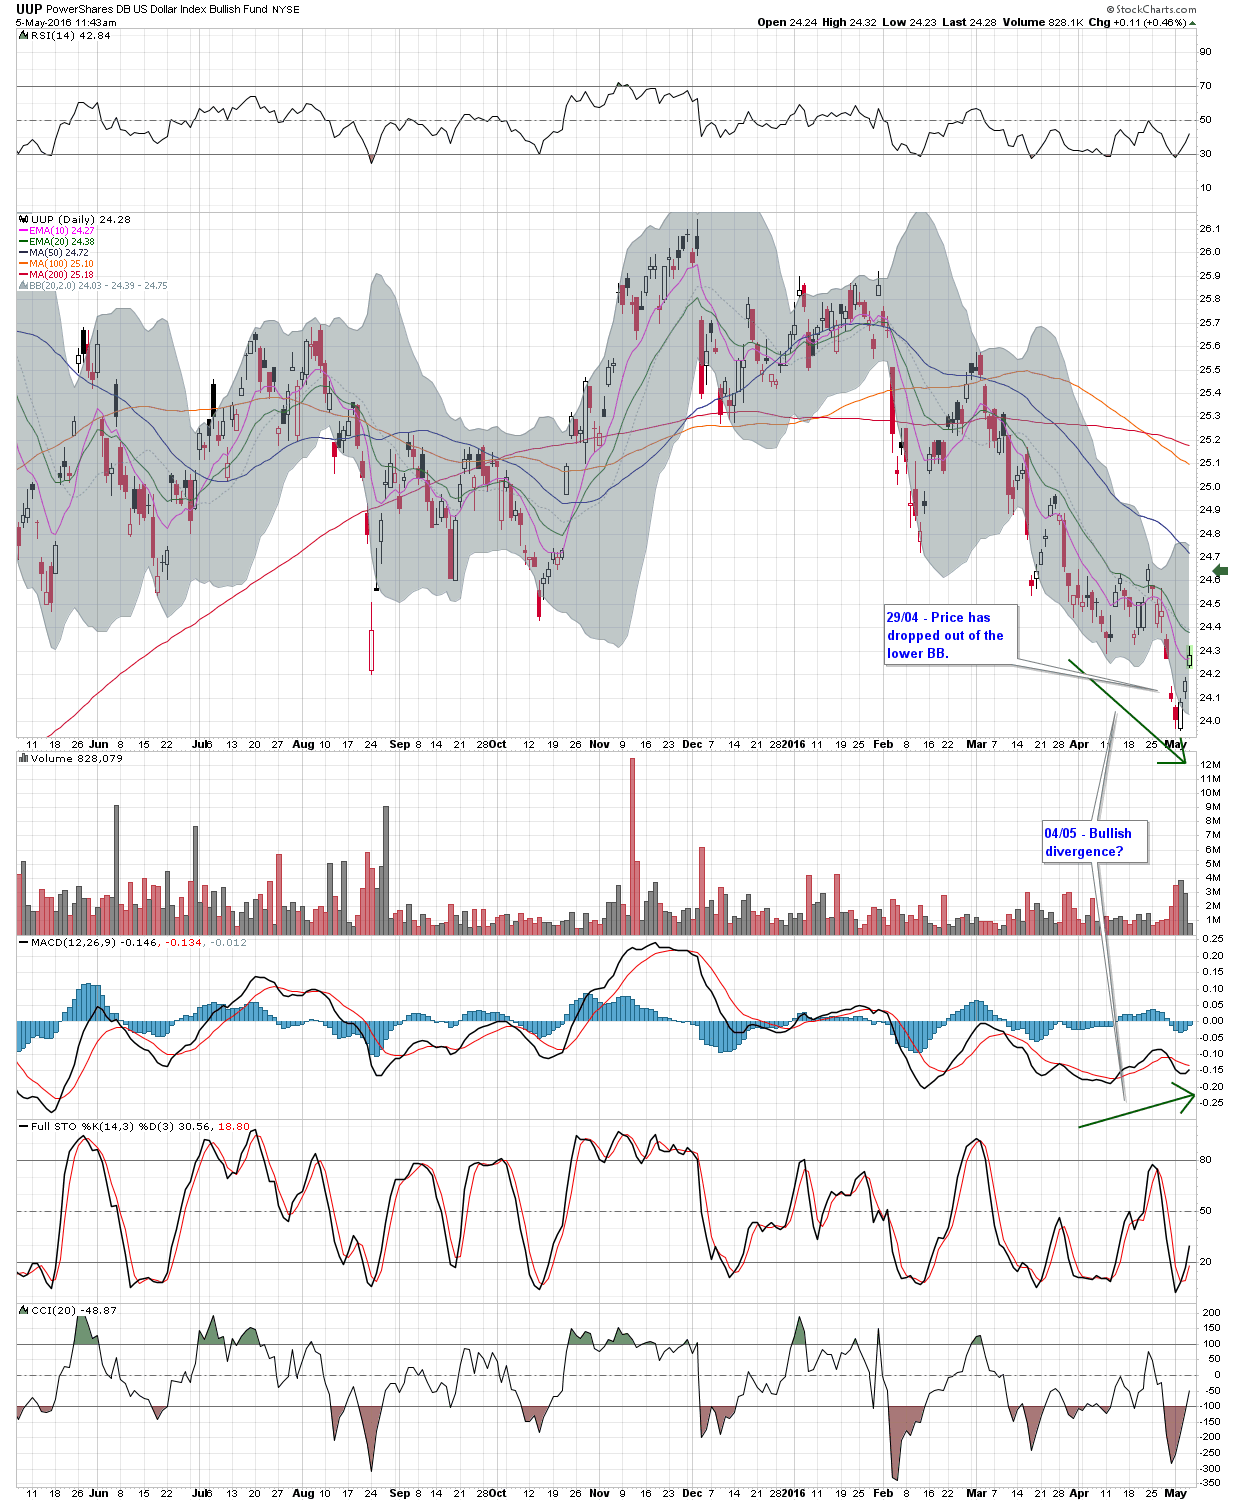
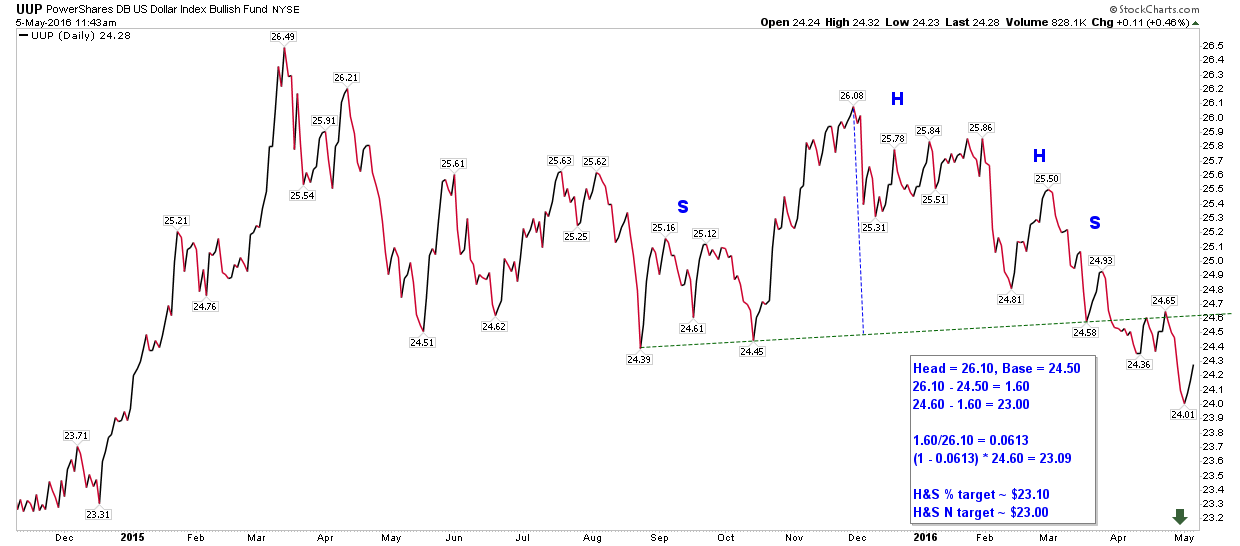
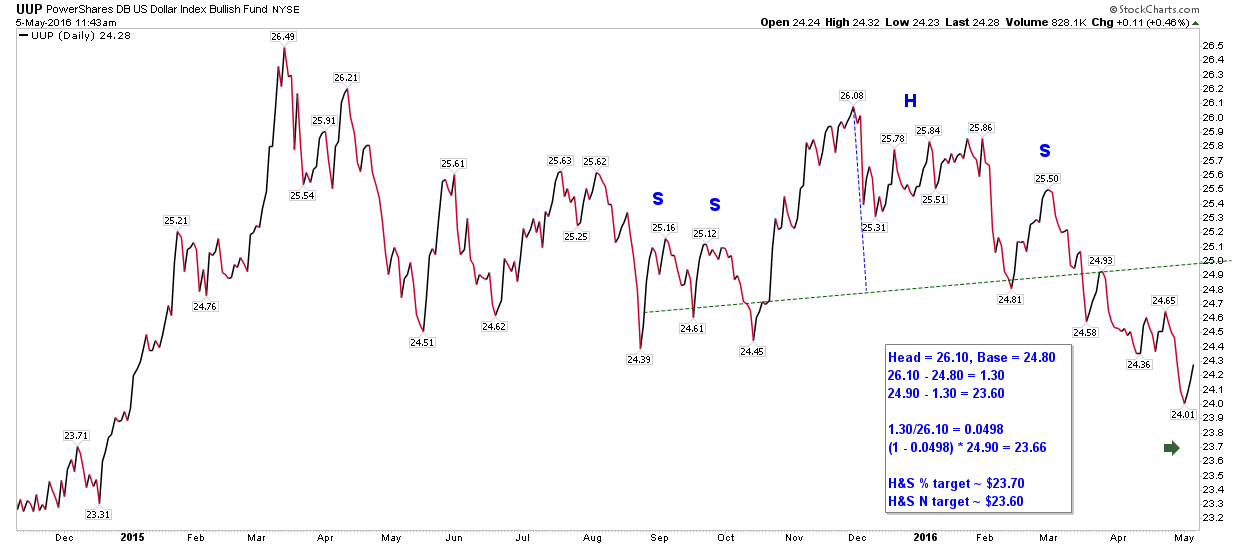
IMO, the dollar looks ripe for a correction from oversold territory and I have 2 possible necklines I’m looking for it to test:
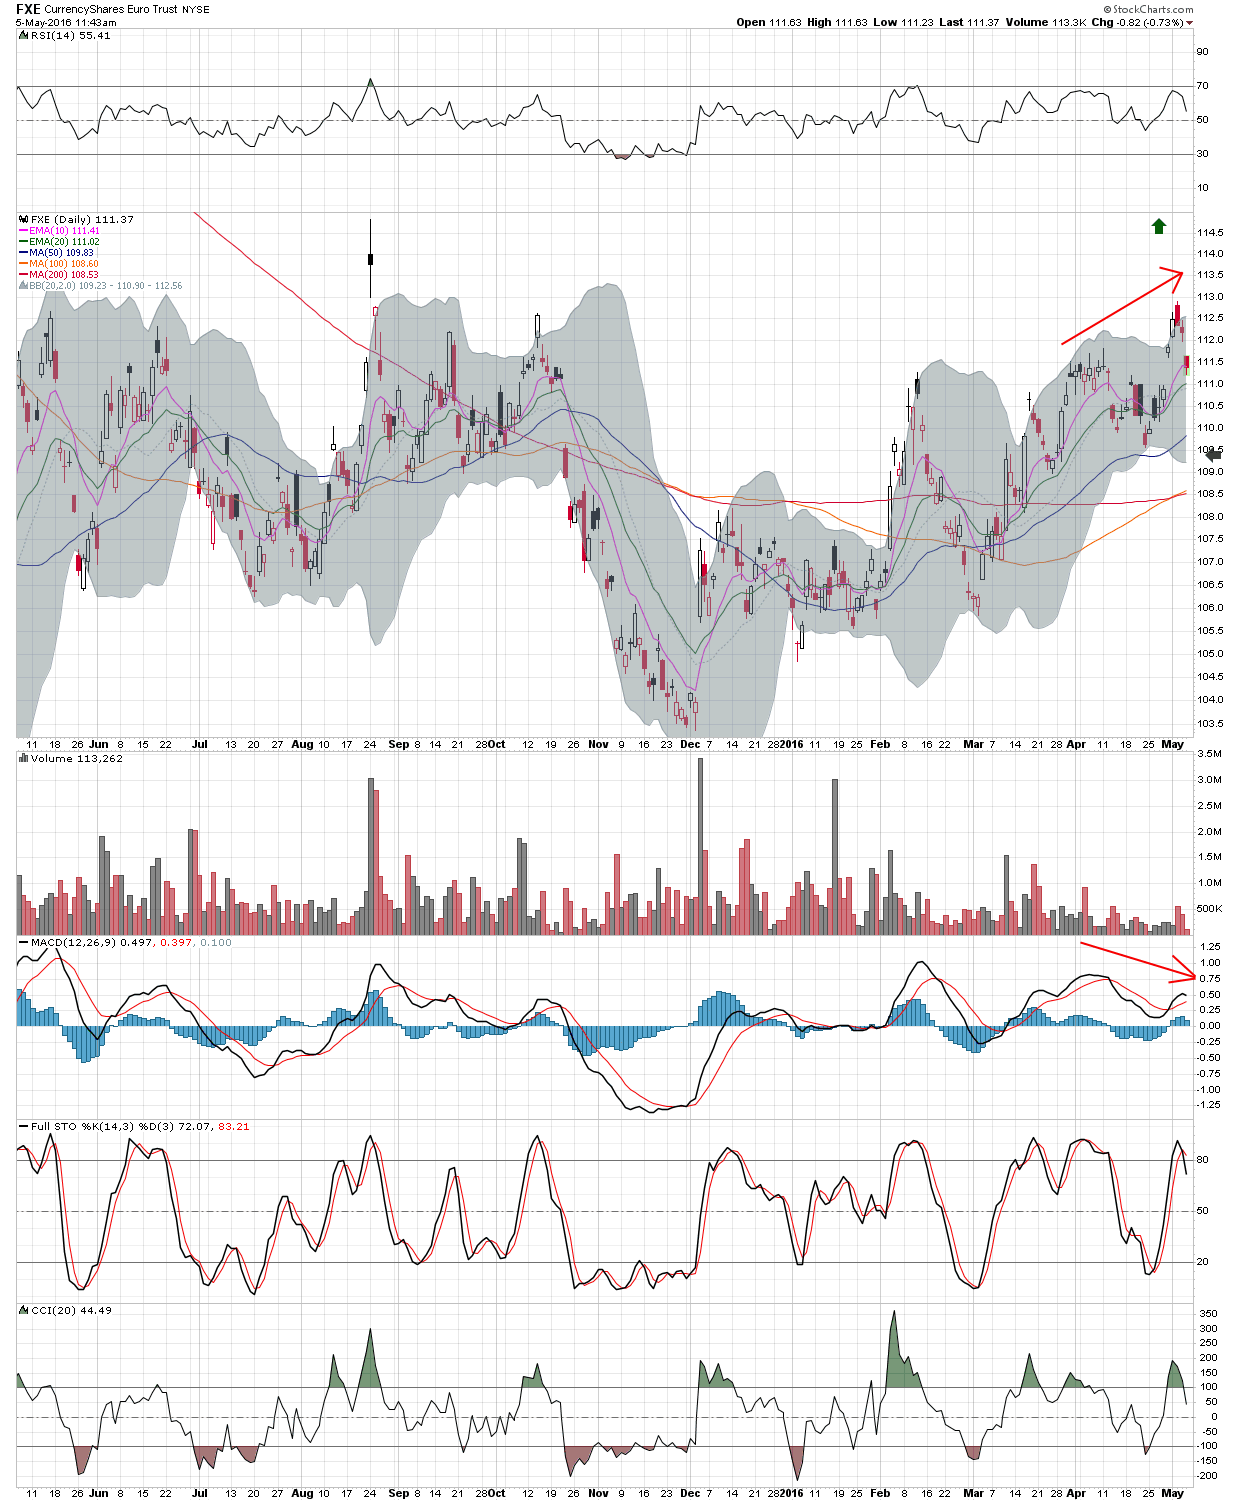
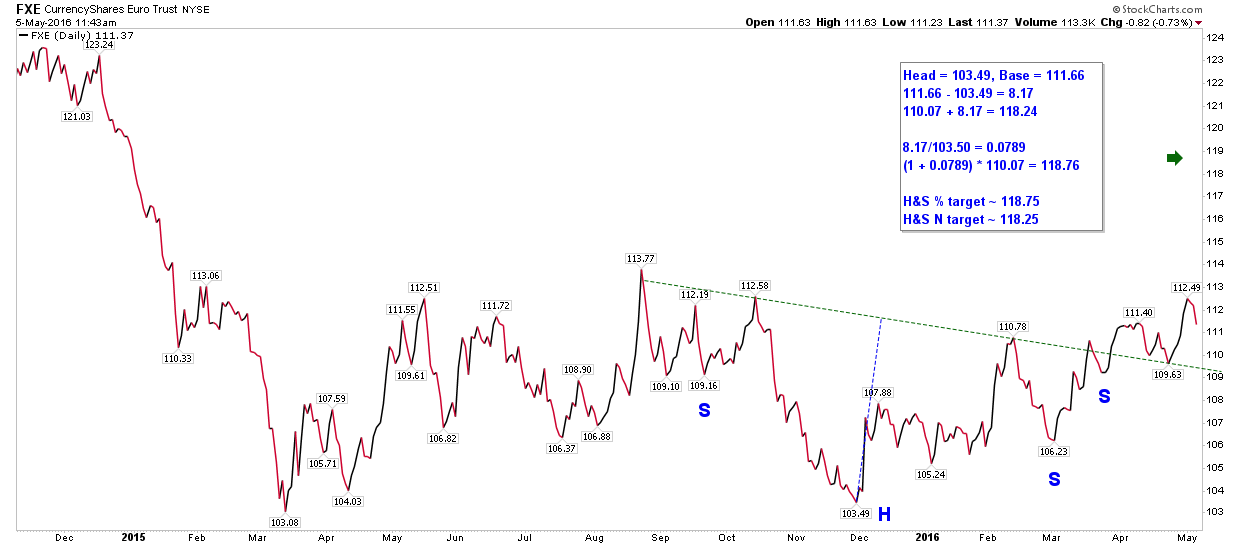
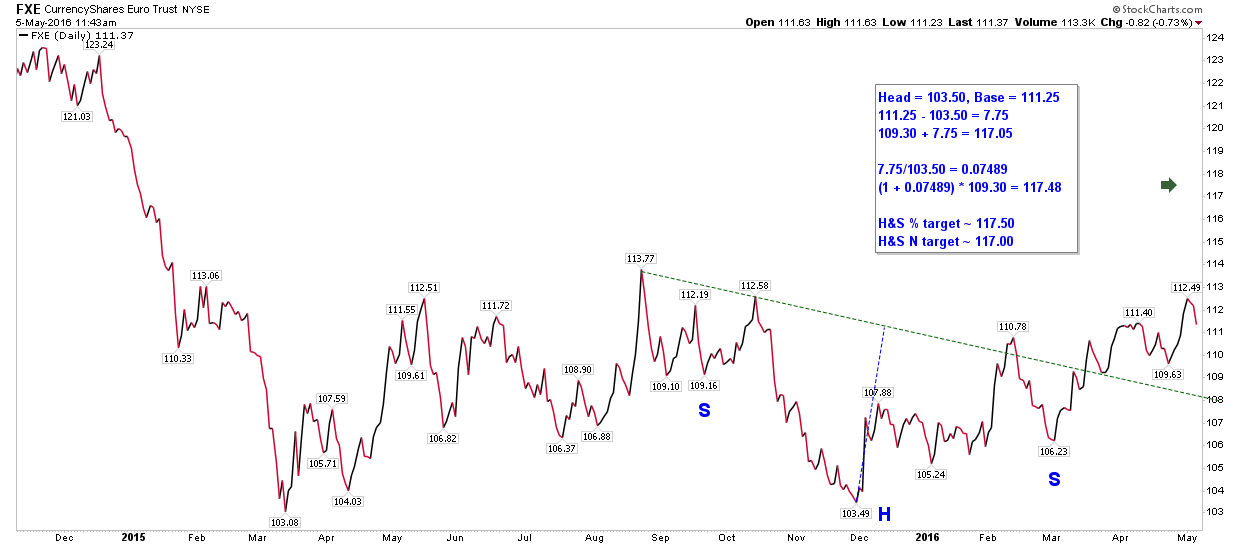
Similarly, FXE is looking to correct from overbought territory and I have a further 3 (posting 2 here), possible IH&S patterns,
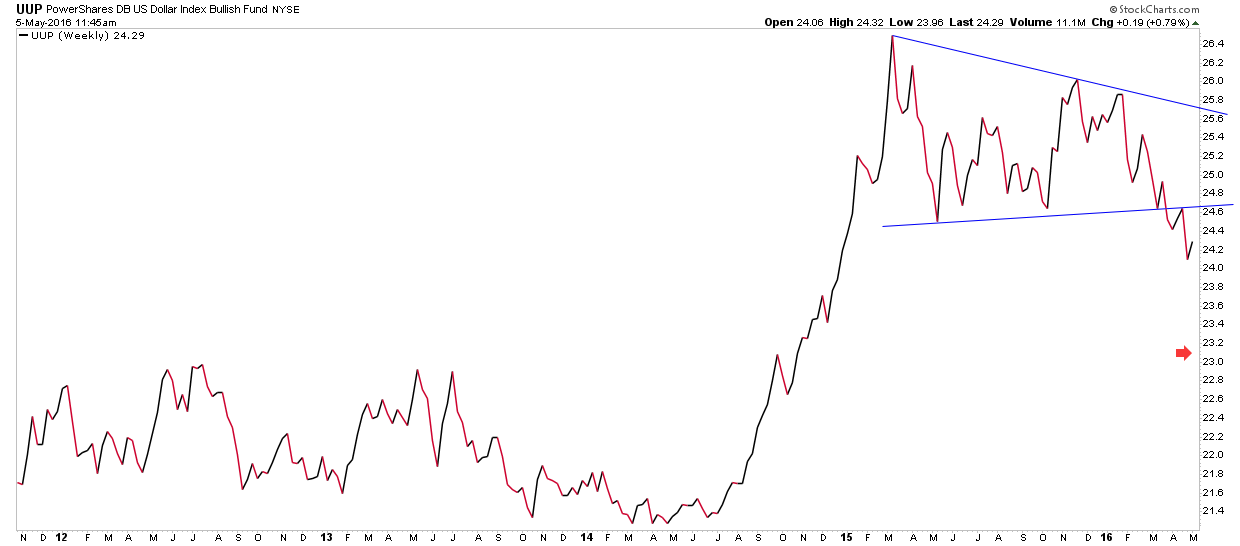
which, I think, confirm the validity of the H&S patterns for UUP:
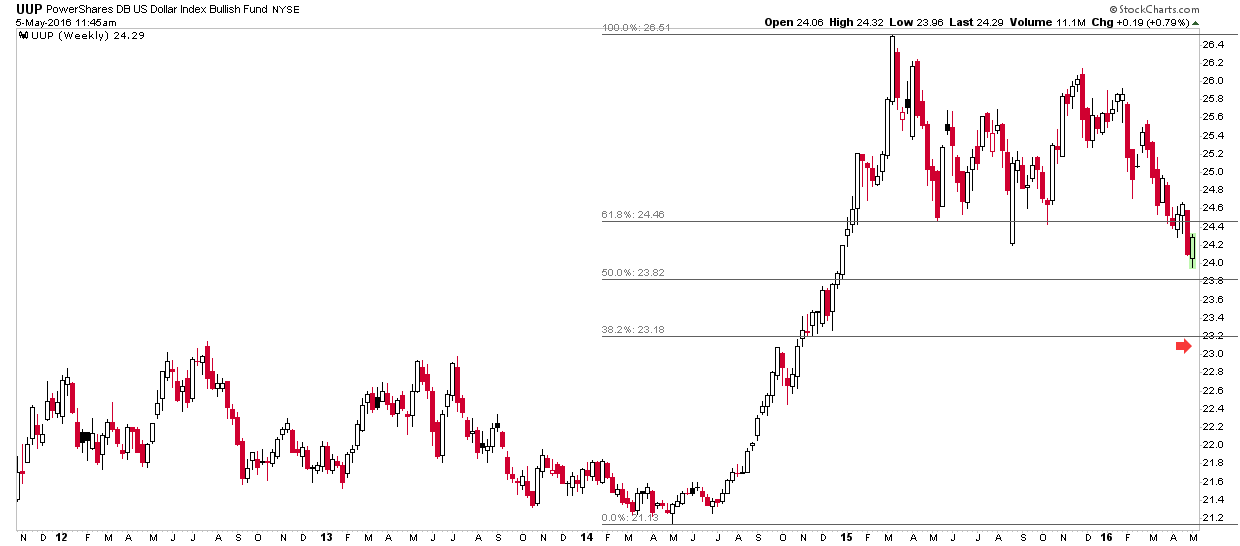
What’s interesting to me are UUP’s weekly charts and $USD’s monthly chart. As of now I’m favoring the 1st H&S pattern
posted above for UUP. If you cross reference that target with UUP’s weekly chart, it comes in at approximately the SMA 200,
which to me adds validity to the target:

The H&S target is also in the ballpark of the 38.2% retracement of the entire rally:
Jumping back to the “what is the correct neckline for the H&S pattern for UUP question”, the weekly line chart
seems to be saying it’s approximately 26:
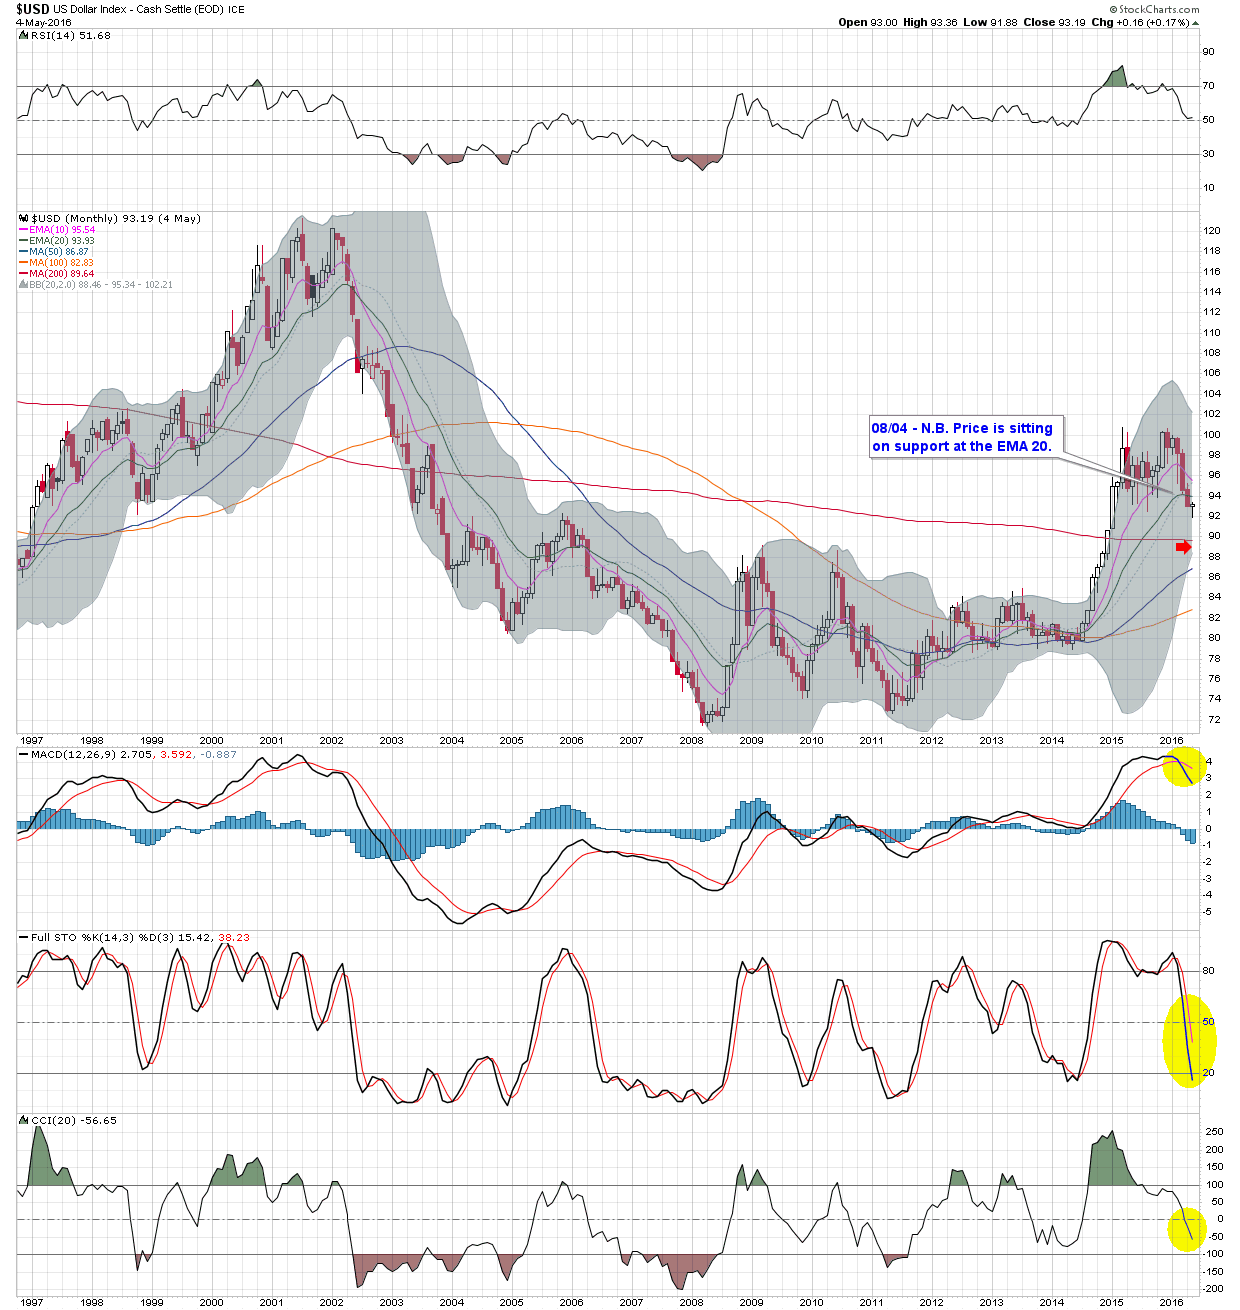
Continuing with the “dollar is going to rally then fall again” theme, $USD’s monthly says to me it has further to fall:
Coming full circle, I think GDXJ is going to test it’s first Fib tracement level, which if it were to happen would
be an entirely normal correction.
GDXJGR needs to correct too. If GLD were to fall to approximatey 119.50 and GDXJ 30.55, GDXJGR would also
fall back to its first Fib R level:
I think if the Employment Situation numbers come in ok tomorrow, or strong, that will be enough for the dollar to
have its little rally before correcting again.
‘The Fever’:

I’d say that’s an understatement if there ever was one! Somebody better hide the champagne from them before they do something foolish!
Caroline are you shorting or just on the sidelines
Haven’t heard from you lately but I understand Socrates has been long PMs for a while now
PS the Champagne is gone …many who got in in Jan and Feb drank it already as Spock Rocks are up 115%
I think we could stand a correction and still be OK
I’m essentially in cash right now….we bought a new house and are renting back from the folks who bought ours so it is “all hands on deck” getting the new place ready to move into on May 17and 18.
I got a video update of the GOlD REPORT from Armstrong Economics and Socrates has had two BUYs but they have been short term BUYs and not long term buys and MA was saying in the video how he wished that the PM sector could just hurry up and find the final bottom and not have the bottom process go on and on and be dragged out beyond the first quarter on 2017…he said a lot depended on the US dollar and he was/would be looking at the Euro for clues about the dollar direction–he is expecting another big rally in the dollar (didn’t say when) but one thing he did say that blew my mine was this: after the bottom the PM bull should run for SEVEN YEARS! WOW SEVEN YEARS!!!
MA also showed the array from Socrates that had 2016 as a PANIC CYCLE YEAR which can mean–HAS meant in other years— where the sentiment is way, way bullish with everyone piled in on the long side and then BANG a reversal that takes the price down to the lows of the year useso he advised CAUTION because the ‘markets are never that easy’ or words to that effect.