Comparison of current upmove to 1982, 1993 and 1999 on daily charts.
I have delved into stockcharts.com for daily chart action on gold in three previous ‘surprise’ or overdone rallies within (or just after) the 1980-1999 bear market.
Here they are:
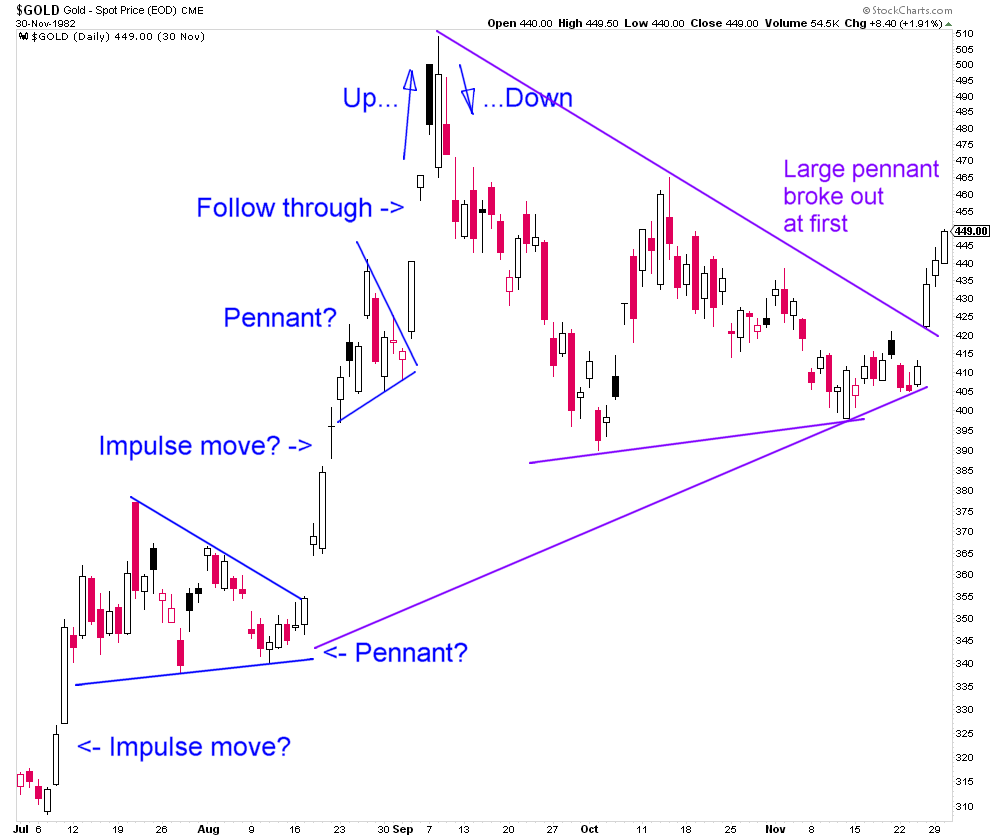
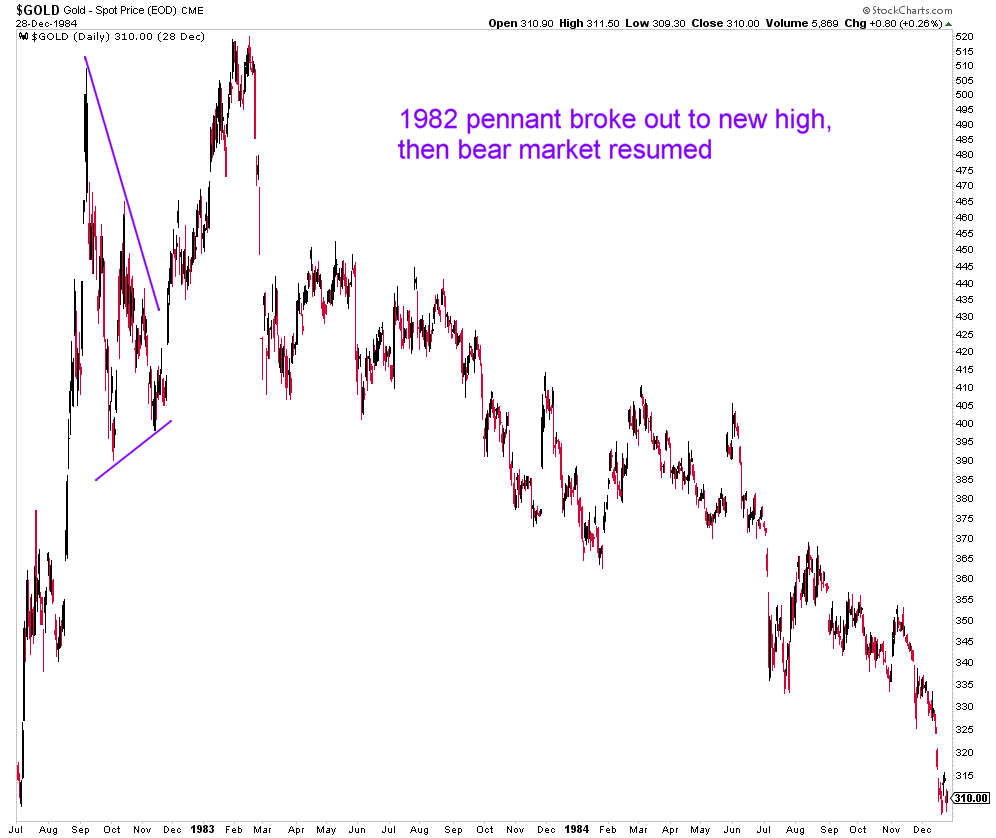
1982: impulsive moves with gaps, follow through after possible pennant, then a straight up, straight down type top. Big pennat then formed and broke out to new high off the page, then failed:
What happened next to the end of 1984 – bear market resumed:
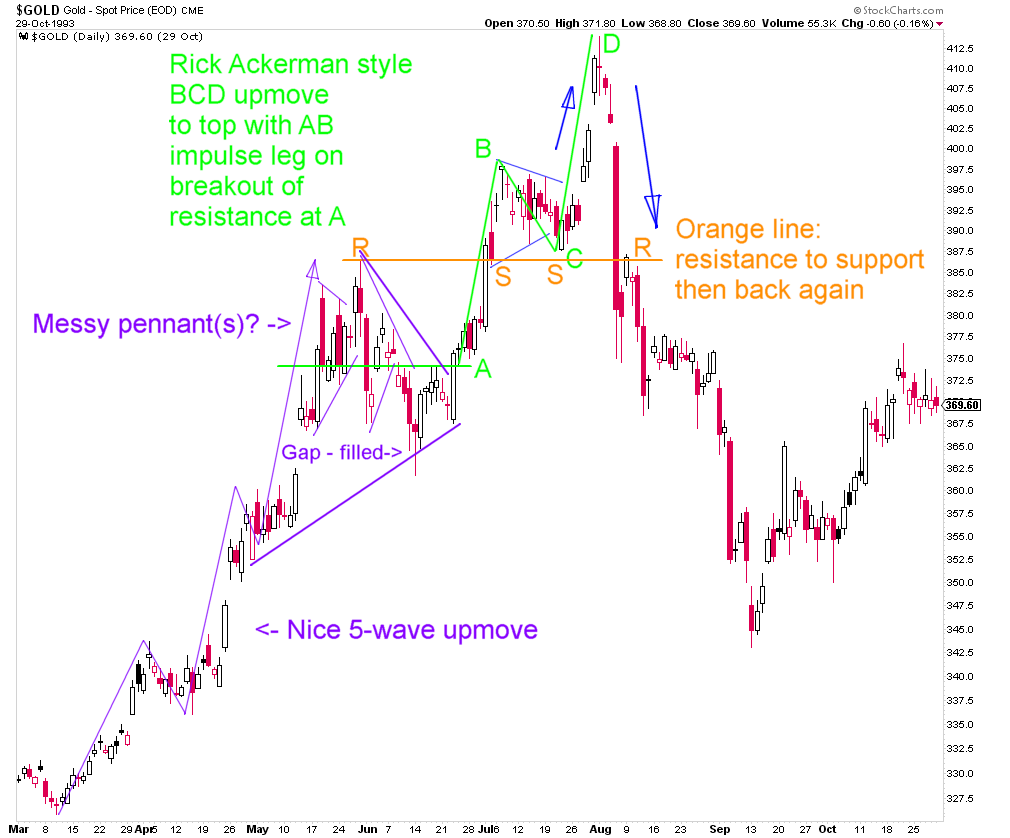
1993: nice 5-wave upmove at start, then it got messy; the top was straight up then straight down and the bear market resumed:
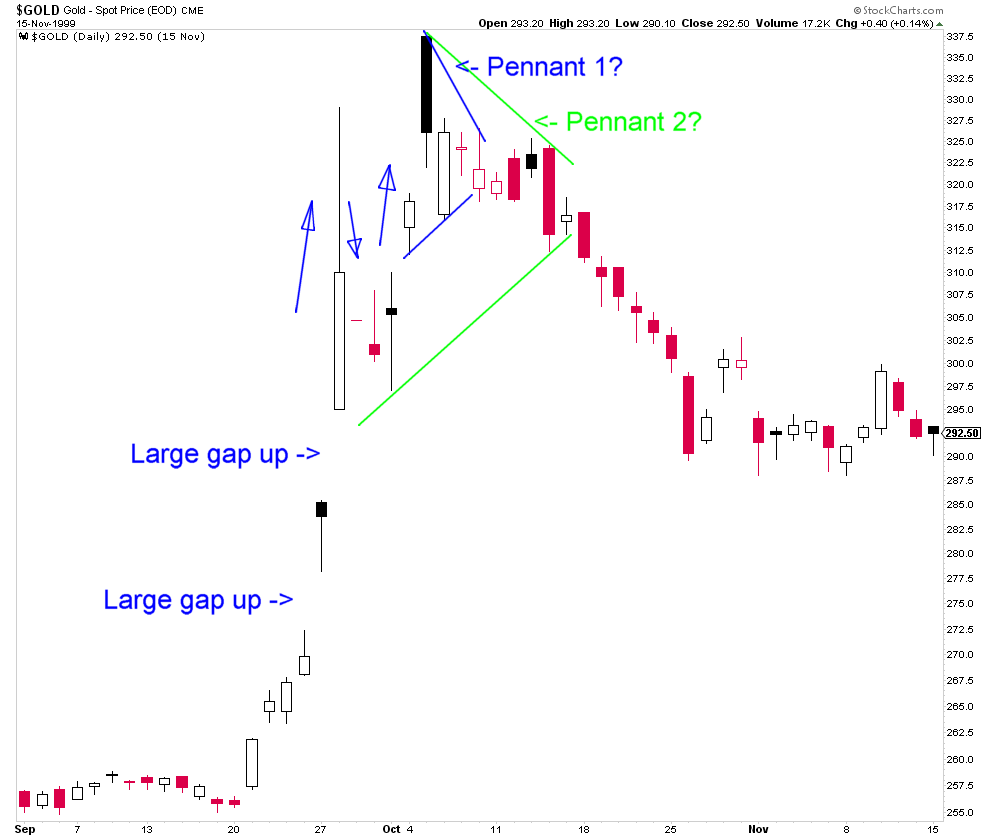
1999: Big gaps up – on Central Bank Gold Agreement, signed 26 September 1999 according to this Wikipedia article. Not quite the same because there was no new bear market low afterwards. Note the lows on this chart just above 255. Those lows were re-tested. The bull market had already started because the Sept 1999 low was already above the early 1999 low at $252.80 (not on chart):
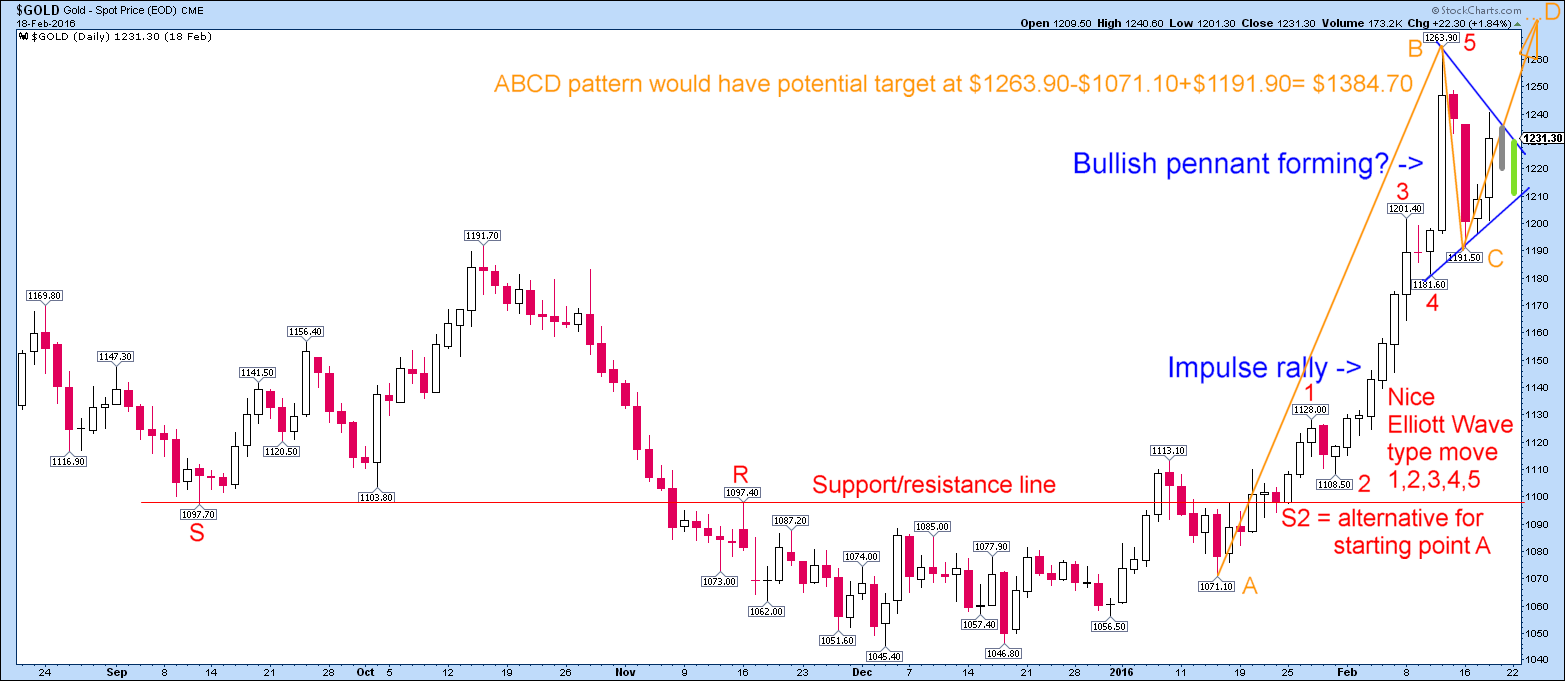
2016: no gaps, continuous move – this looks a lot neater than any of the above examples to me:
Nice work, Dave – thanks. Confirms triangulated targets nicely. Now let’s see if gold follows through or not next week.
Great detective work! you can really see WD Gann’s “secondary reaction” in the first 3–the reaction that sets the first higher low and confirms the new bull move in a way….but I think I am going to lighten up some of my positions first thing Monday monring
I am going to study this “secondary reaction” – sounds interesting! Cheers!
Great detective work! you can really see WD Gann’s “secondary reaction” in the first 3–the reaction that sets the first higher low and confirms the new bull move in a way….but I think I am going to lighten up some of my positions first thing Monday monring