Jack Chan long term SPX
In the extended EW exchange a few pages down, Cashcosts mentioned Avi Gilburt as one of the ‘hotter’ EWers. Yet Avi is generally maintaining a very bullish longer term outlook for SPX. This chart from Chan raises serious questions about Avi’s big picture SPX count in my mind. Avi also thinks a gold bull revival is NEXT. But his LT wave count for gold starts from 2000, like many others. If you start from the wrong place in EW with your count, you never find the right trail. That’s why I went back MUCH further for gold. (And that’s why I also rely on my long term TA tools to validate ‘where we are’ in the counts).
My point is that good technicians on the shorter time frames can easily go astray on the longer ones. My issue with Jason (Pretzel) is that he only trades “the present”. That serves him and other ES traders very well, but not everyone trades that way. Some of us depend on longer term views. With that background, here is Jack Chan’s system. TLB .. trendline break … BS and SS are buy and sell signals. This chart is from Oct 30. He’s been biased LT short ever since. Its not for pinpoint trading — its for whether he’s looking mostly for long trades or short trades. Since the TLB, he’s looked for short side setups. Bottom line, toss the bullish SPX wave counts out until further notice.
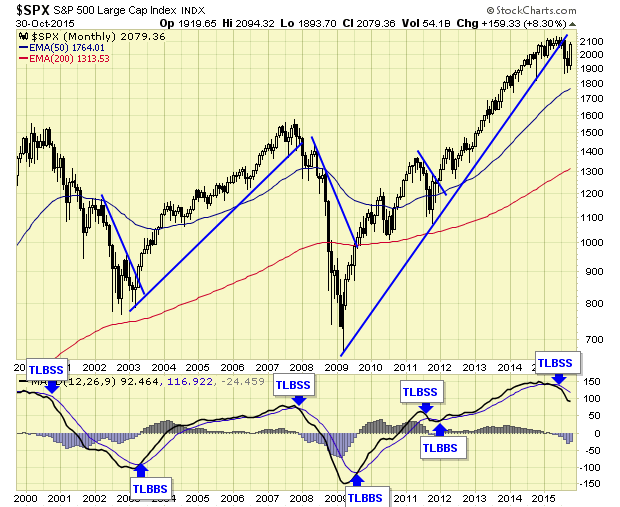
PS — there is one issue with Chan’s system that I’ve never fully resolved. Where PRECISELY do you draw the trendline? It might look obvious now, in retrospect. But its an exercise all on its own.