40 barrels of oil for 1 oz of gold coming soon? Line up at the gas station!
The Gold:WTIC Oil ratio is now over 39 as I write. I was wondering if it had hit 40 yet. Not quite but I call this a breakout, however you draw the lines. The whole vertical scale of this chart has been compressed in the past few days for the first time in 30+ years to fit on the new numbers.
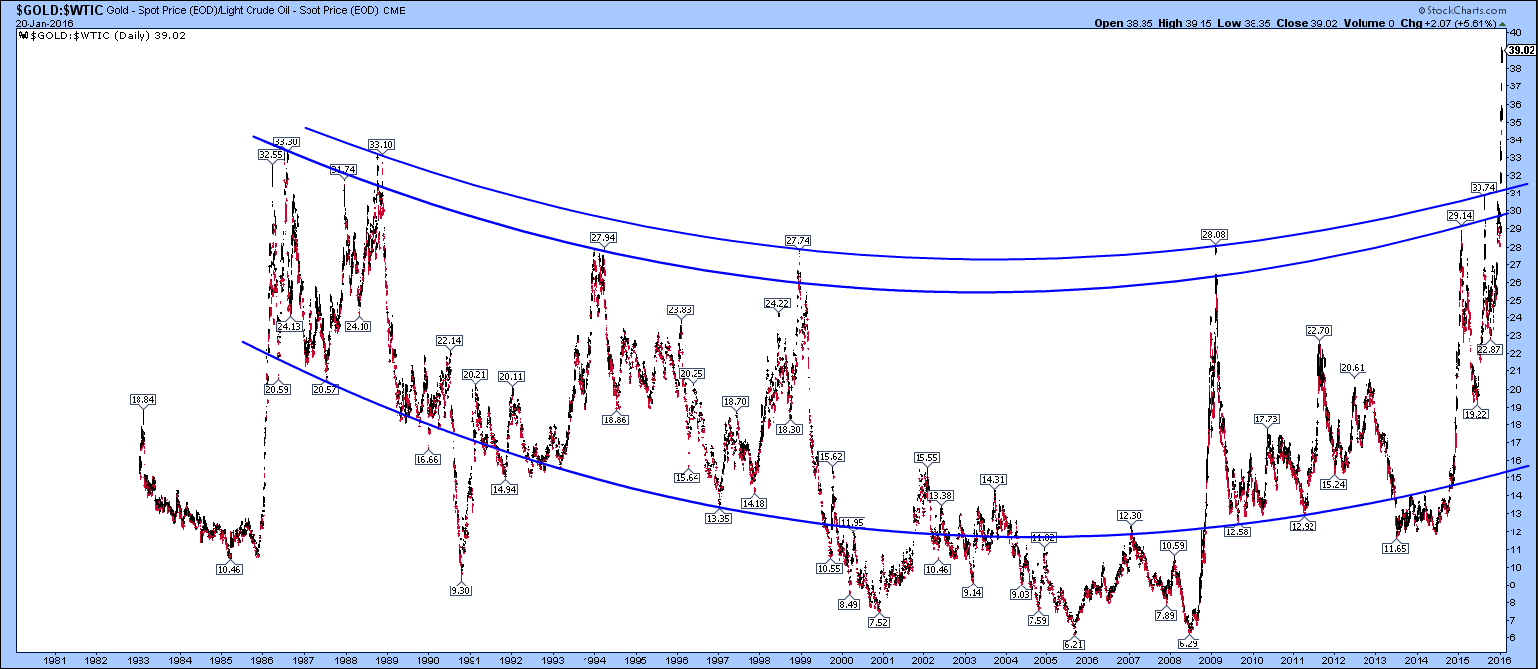
What does it mean? Search me! It’s just jolly interesting.
Will a back-test of the 33 level confirm this breakout?
I have been looking for gold:oil ratio data for prior higher highs and the best I can do is a ratio of about 40 in 1933/34 from a chart posted by Hubert Moolman. So the middle of the Great Depression is prior resistance for this ratio, although the data is yearly averages and there was the revaluation of gold from $20.67/oz to $35/oz in that period to confuse things (oops – the devaluation of the dollar I mean).
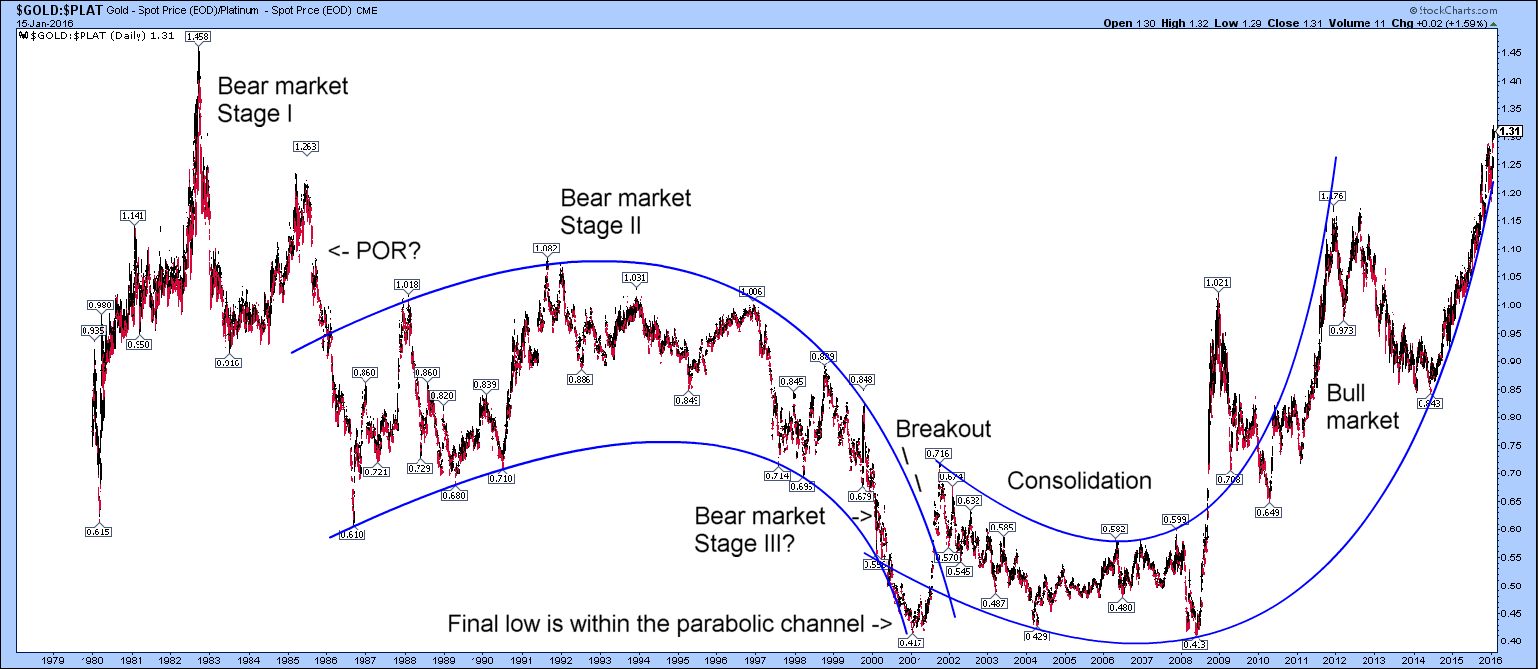
Were not some bigwigs in the resources business going bullish on platinum over the past few years as the gold:platinum ratio went over 1? Oops! It’s been going parabolic in the opposite direction. Duh!
On 24 Jan 2016 I am adding the gold:CRB chart for comparison with the above two, especially the gold:oil chart:
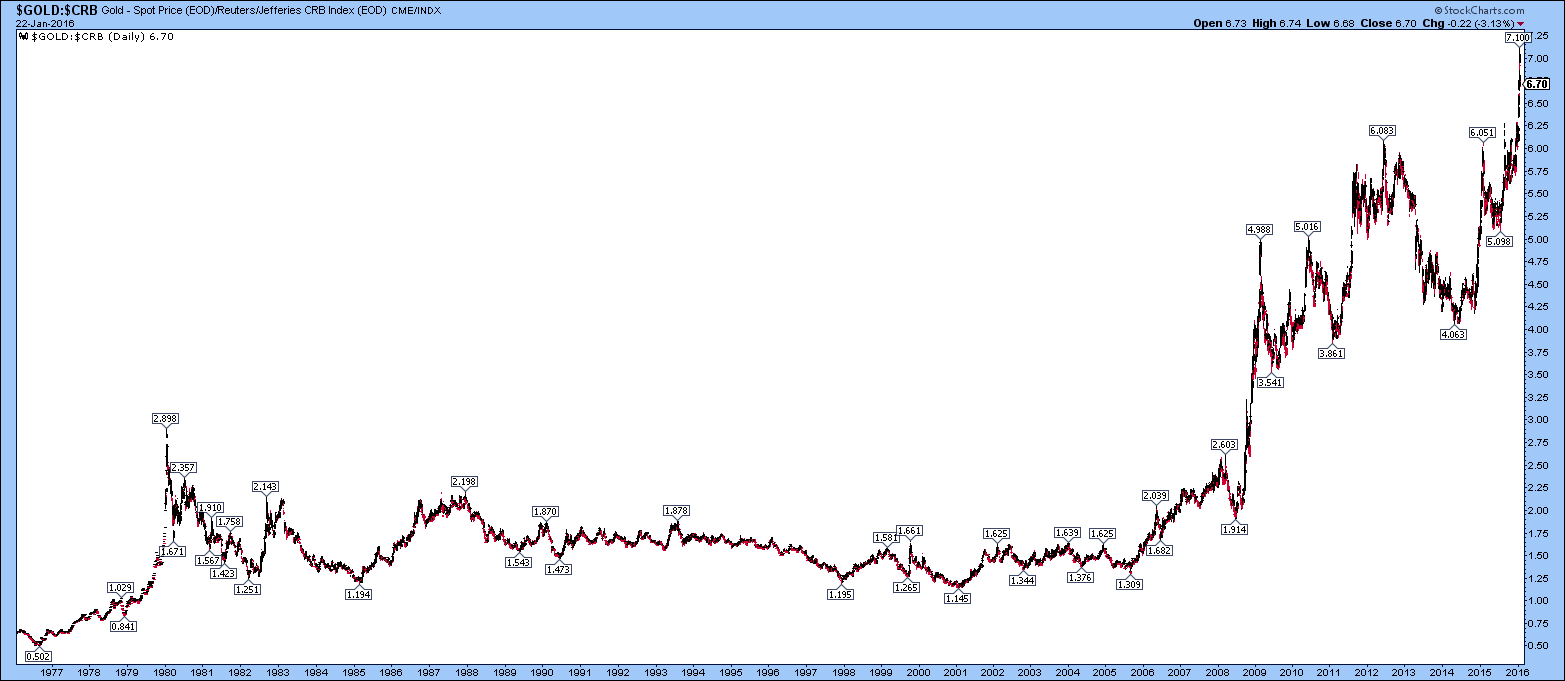
I had originally been looking at the massive breakout at the turn from 2008 into 2009 into a trading range not seen for at least 40 years but when I origianlly looked at this chart a couple of weeks ago, it didn’t have the second breakout that has just been noted by Spock here:
http://goldtadise.com/?p=360880
Dave
You make a GOOD Point !
New…uncharted territory has a whole new meaning !
Nice
PS : I mean Jolly Nice …
🙂
The ratio has pulled back a little since the bounce in the oil and the general stock markets following the middle of 20 January (yesterday). It will be interesting to see if gold:oil revisits the 30-33 area and what happens if it does.
As for the gold:platinum ratio, I note that it is not at an all time high. However, it looks like it has been going truly parabolic lately (not far from vertical on a long term chart) and could slip a bit quite soon. How much longer can it keep up the pace?