Sam’s LT count for gold 1-1-16
Sam began subscribing to my LT count this past summer, about a year after I first posted a chart with this wave count on his forum thread at MexicoMike back in August 2014.
We still disagree on details. In particular, I think he has 2016 reversed. I have us lower into midyear then the B wave rally begins. Otherwise, we’re more or less in synch.
English is his second language, fyi.
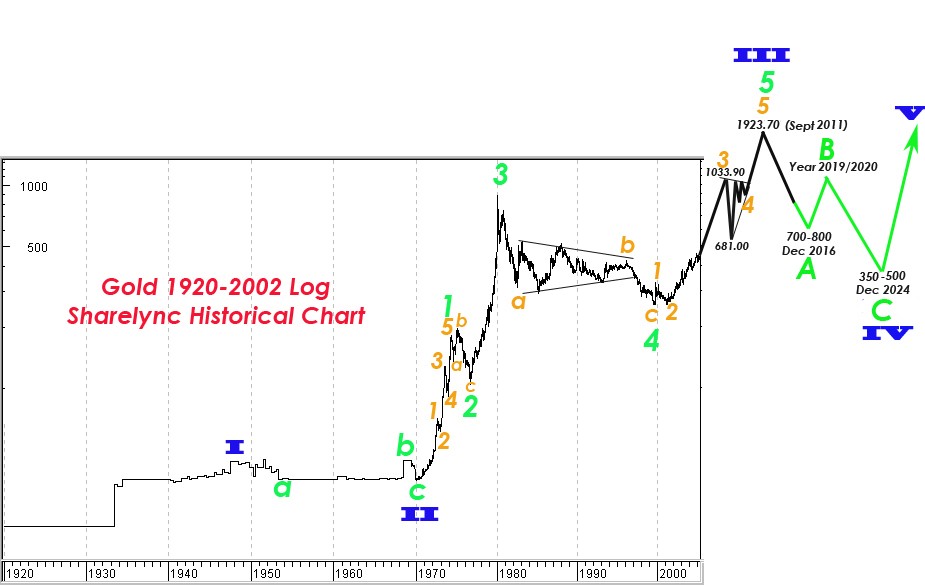
“The current bear run for gold and commodities markets are correcting and digesting the gains since 1970 lows, the current bear markets for gold and commodities are of higher degree and they will last longer and fall deeper.
The corrections are of higher degree and all markets that I follow and track come together after carefully review and they make sense now. They now all seem to align together and move in sync for the remaining of the bear markets.
… SPX, gold, oil and natural gas will be strong in upside moves the beginning 4-6 months of 2016 and then they will fall down hard to new lows second half of 2016. This will follow by 3-4 years (to year 2019-2020) strong intermediate term rebound, but then they again meet with subsequent meltdown to ultimate new lows by year 2022-2024.”
To the folks with some knowledge of EW principles, note the nice alternation between blue II and blue IV. Blue II was shallow and drawn out. Blue IV promises to take less time, but be far more deep.
First of all I should forget gold being above $2000. Or $5000-$10000 in my life time by looking at this wave count.
Pedro- ???
Why every one assume expanded flat is unfolding after grand super cycle wave III (blue)is complete??
Expanded wave needs to be 3-3-5. Is this correct? Did current wave down from $1923 met the requirement of 3?
I have paid EW letter and the analyst has the same grand Super cycle wave count.
Thanks.
I don’t regard blue III on Sam’s chart as a Grand Super Cycle, for one thing. Those last a century if not more. The whole five wave structure (from 1920 to 2050) is likely a SC.
The confusion you are having is because Sam’s blue count (in the chart directly above) is not the same degree as my blue count (see top link in keepers), which puts Blue II at the start of his chart, around 1920. He is not using the same color scheme. My green counts are turned into blue ones on Sam’s chart.
So if you go back to my original chart, going back to 1800, the GSC requires completion of this green IV we are in (to 2025?), a green V to complete the cycle from 1930, then blue IV to alternate with wave II that ended in 1920. And then a final blue wave V to finish the GSC.
I don’t have control over the color scheme Sam chooses to use (and he composed the original chart from my VLT chart to my specifications), so going back and forth will likely cause headaches. But within the period that Sam has focused on in his 1-1-16 chart, the counts are consistent if you put aside the color choices.
For those who want to know important EW rule of alteration click on the following link:
http://www.mtpredictor.com/The-rule-of-Alternation
Sorry Pedro I am clogging the comments here. I am studying your EW on gold including the past one.
The current grand super cycle wave count you noted that blue wave III is complete at $1923. (That is not your count I assume?)
But in earlier post you had Blue wave III is still unfolding and an incomplete structure.
http://goldtadise.com/?p=351923
Please clarify?? i am confused.
The top at 1923 in 2011 ended a third wave up from 1970.
In turn, there is a higher degree third wave that started around WWI. After this correction ends in about 2025, this larger third wave needs a final 5th wave up to complete. Let’s say to 2050.
Then we get an even larger degree 4th wave, that will alternate with the move from the Civil War to the WWI pullback. Then a final fifth wave perhaps to 2200 (on the calendar, not the dollar scale).
Sorry .. but the easy money was made back in the 70s!! That was the 3rd (black) of a 3rd (green) of a 3rd (blue) from my original chart. The upside though with EW is that it implies that humanity will be around awhile longer (assuming no nuclear truncation). That’s one way to look at the bright side of things, no?
Thanks for Taking the Ball Bikoo
I am interested in Pedro’s response to your questions