Gold – Long Term Elliott view
Overview
This article presents the view that the Precious Metals Complex is in the midst of a much longer and deeper correction than most suspect.
From a technical standpoint, both Traditional Analysis and Elliott Wave (EW) principles support this view.
EW guidelines suggest that gold’s correction will bottom in the range traversed by price during the prior fourth wave of one lesser degree that I place as transpiring from 1980-99. This yields a target range of $250 to $500. I doubt we get to a final bottom before 2020.
For those who don’t subscribe to technical analysis, there is also solid fundamental reasoning behind this outlook that will be presented in this essay.
…………………………
Conceptual Credits :
Back in 2011, several analysts were tracking the likelihood of a major top for gold in 2011 using EW as it was forming. Neither nailed it precisely but both were issuing warnings after gold rose above $1750 per ounce. Others at the time, some using EW and others not, were looking optimistically for $2500 and well beyond. However, even those who were expecting a top at that time were, and largely still are, looking for a correction simply to the bull market run of 2000 to 2011. My belief is that we are correcting the entire rise from 1970.
I came to this view in mid 2014, after seeing EW analysis published by MC Trader on the Market Oracle site. He looked back at gold prices since 1970 from an EW perspective. I did not subscribe to that author’s count or conclusions, but that analysis prompted a collaborative effort with another EW analyst posting as samxxli (“Sam”) from a Canadian based gold bug forum (Smart Investment / mexicomike.ca). Sam located ShareLynx data going back to 1800 and posted an EW count that I regarded as a solid foundation from which to proceed. I proposed a number of adjustments to that initial effort. Incorporating those changes, Sam posted a chart with my long term count on August 1, 2014 on his subforum. The current effort to reach a broader audience with that analysis owes to a posting in early September 2015 by Plunger at Goldtent, who also believes we are correcting the ascent from 1970. We came to our shared view independently of one another. At this time, the potential for a correction of the entire credit boom, precious metals included, going back to the 1970s is not appreciated by most market analysts.
………………………………………………
EW Analysis :
I generally don’t rely primarily on EW to do my trading analysis. I also don’t claim to be a master of its more subtle rules and regularities. However, I believe that EW does have the ability to recognize structural patterns in price movements that can often help limit the range of scenarios considered for future movements. And for conducting LT analysis spanning decades, there are few if any alternatives capable of yielding comparable insights. I also believe EW is useful as a means for effectively communicating a trader’s vision of the market in a concise visual manner.
After the high for gold in 2011 was marked and declines ensued, several of the more prominent and respected analysts who apply EW principles to gold saw the decline as just a temporary pullback in an ongoing bull market. However, few if any of these analysts were stepping back and charting gold’s moves from before 2000 to guide their analysis. Consequently, there was no chance they could view the move down off the 2011 highs as anything but a correction of some kind to that 11-year rally from 2000. That began to change for me with Trader MC’s post at Market Oracle, who took his EW analysis of gold view back to 1970. It was that effort that prompted me to propose an alternative LT count, as charted and posted with Sam’s help.
Chart 1 Gold ($/ounce) from 1800-2015.

Chart 1 depicts a bull market in gold priced in US dollars — higher highs and higher lows dating back to the inception of the USA. Prices reached an initial peak during the Civil War in Cycle I. Prices pulled back in Cycle II prior to the Great Depression. Prices have since moved higher throughout Cycle III beginning with FDR’s default in 1934. Federal Reserve publications document a brief spike during the Korean Conflict not evident in all data series, after which prices dropped back in Primary 2. The gold market bull erupted more fully after Nixon’s default in 1971, which enabled decades of financial “innovation” — including shadow banking — that led to a relentless issuance of new credit, eventually spreading worldwide thanks to rate cuts and asset purchases through the concerted efforts of major central banks led by the Fed. The resulting debt-stoked growth in spending has driven all asset prices, including gold, to unprecedented levels. This was the ‘wondrous to behold’ (green) wave 3 of (blue) wave III of Elliott renown. But nothing rises in a straight line, and gold witnessed large corrections – one deep but brief in the mid 70s, and a protracted one spanning the 80s and 90s. Those two corrections were notably different in character, in line with the EW principle of alternation that is commonly found when comparing wave 2 with wave 4 corrections within a single larger impulsive move.
The chart shows principally impulsive patterns, where three waves (1, 3 and 5) are motive waves running in line with the major trend. Waves 2 and 4 are corrective. When it concludes years from now, Cycle wave III will consist of five green Primary waves. EW is fractal, so impulsive subwaves follow the same pattern. Within Cycle wave III, primary green wave 3 (1970 to 2011) has five black subwaves. Subwaves within the wave 2 and 4 corrective moves – that usually involve one or more internal abc sequences — are not shown except for the ongoing decline from 2011. Black wave 4 ending in 1999 shows a 20yr (unlabeled) ABC correction with a drawn out symmetric triangle B wave.
If this overall analysis is correct, then 2000-2011 was the fifth and final subwave of Primary (green) wave 3. And as a major top, the ongoing Primary (green) wave 4 will likely correct a major portion of the rise from 1970, not just black wave 5 alone as most are supposing. EW guidelines suggest that it will bottom in the range traversed by black wave 4, the prior fourth wave of one lesser degree. That gives us a target range of $250 to $500, roughly, where most of the price action in black wave 4 took place. We are currently in black wave a of Green wave 4, which has already taken four years. Once this current black wave a completes, we can expect a rebound wave b that will retrace a portion of the decline since 2011. But wave c will eventually take prices to new lows after that. This assumes that wave 4 takes the form of a zig zag, which is frequently claimed to be the most common type of corrective pattern. This outcome implies that a severe deflationary crisis is likely to unfold in the near future. Given how long wave a has already taken without completing, and minimally using A=C, I expect that wave c will not complete before 2020.
……………………………………………
Traditional Technical Analysis of Green Wave 4
Chart 2 Monthly Gold and MACD
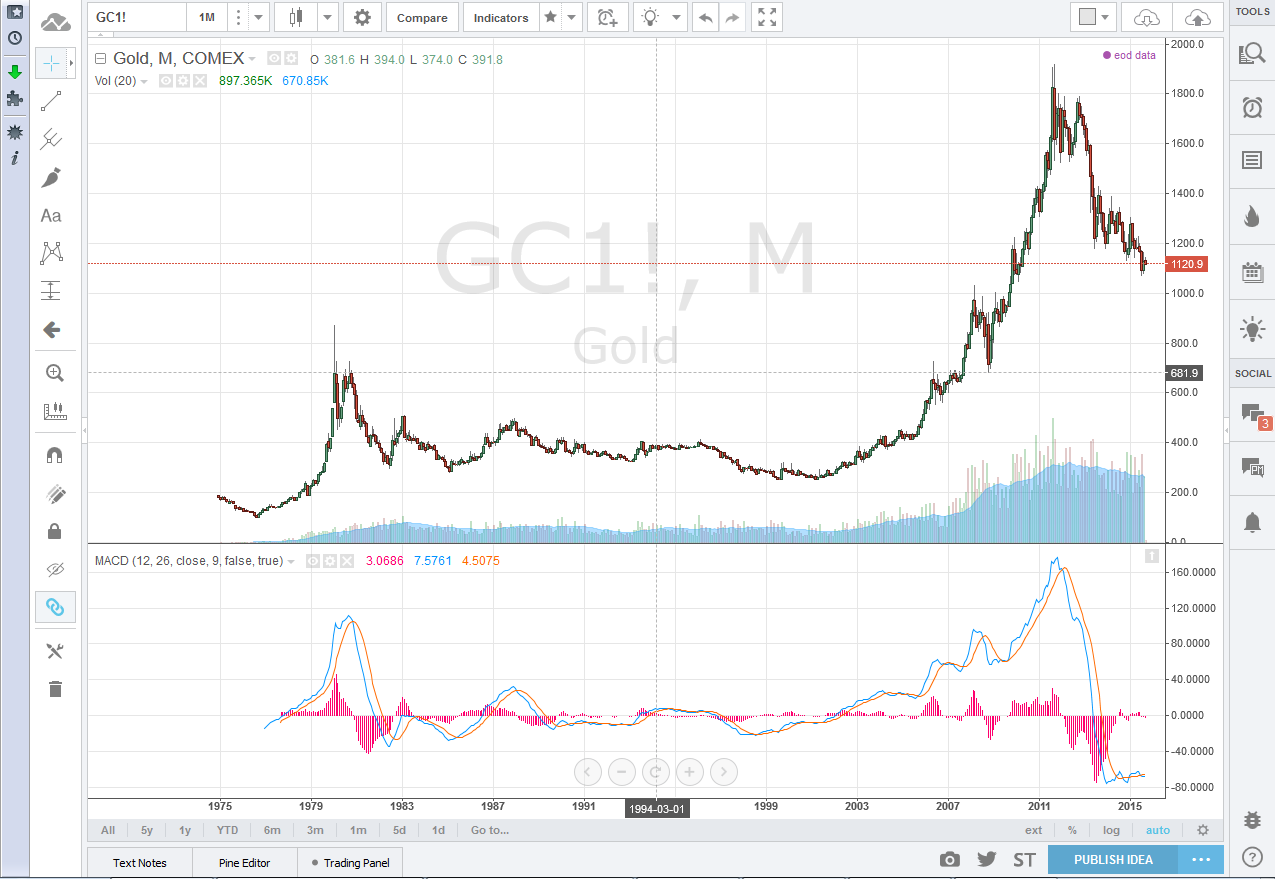
Chart 2 presents a monthly chart of gold with the macd indicator. If Green wave a (or this wave but labeled in some other fashion) was to mark the end of the correction from 2011 any time soon, as some are now anticipating, traditional indicators like the macd would be displaying divergences on long term charts consistent with a major bottom. These are not apparent now. And they contrast with how these indicators appeared at the 2000 lows going into the resumption of the bull run in 2001. Sustained bullish moves, as opposed to bear market rallies, appear to require (divergent) higher lows in the monthly macd and proximity to the zero line. Gold’s monthly macd is currently at historic lows, with neither a divergence in place nor proximity to a bullish zero line crossover. The expected b wave rally will likely take the macd back to the vicinity of the zero line before failing. The c wave should complete in a manner that leaves the macd line well above current levels and within striking distance of crossing into positive territory again to signal a resumption of the bull market in green wave 5.
Some contend that we can expect to see the miners begin moving well ahead of gold. Using quarterlies for HUI, the macd is at 10 year lows, well below zero, and falling faster than in the previous quarter. I would expect to see convexity and perhaps a near zero quarter to quarter delta as a significant bottom approaches. And progress toward the zero line rather than away from it as is evident now. As of 2015 Q3, more sensitive indicators (CCI, Fast Stochastics, various price oscillators) set to faster than standard specifications are also falling rather than turning up.
…………………………………….
Further EW Thoughts on Green Wave 4 :
During the eventual wave c down during the credit bubble collapse, gold could well outperform other assets on a relative basis (as it is no one’s liability) but it should still decline in nominal price as wealth evaporates via chain reaction defaults, as survival becomes a concern for many, and as gold is liquidated to meet margin calls of various kinds (some sovereign nations experiencing financial stress are already liquidating US Treasuries at this time). It is possible that Green 4 can take other forms, as wave 4 patterns are notoriously variable. A drawn out triangle in five subwaves is one possibility. A closer look at Green wave 2 from 1951 to 1970 using EW could be useful to delve more deeply into the implications of the alternation guideline for what we might expect from Green 4.
……………………………………
The Fundamental Story – The Global Credit Bubble and Peak Debt:
With its high in 2011, gold was earlier than other commodities in anticipating the ongoing rout. And commodities in general now appear to be reflecting rapidly diminishing global growth prospects, for China in particular but also emerging markets in general. And weakness in emerging markets is bound to spread further. Howver, concerns over growth were also being anticipated by those focused on mounting debt, initially as it has been accruing for years in the West, but more recently as more attention is zeroing in on China. For some time, there have been numerous commentators observing the broader market picture predicting that we were coming up on Peak Debt, and that we were in some kind of epic credit bubble that would eventually burst. A. Gary Shilling published a book titled Deflation in 1998 that first sparked my attention. Doug Noland has also been chronicling this credit bubble mania since about that time in gory detail every week. More recently, Automatic Earth, Chris Martenson, and many others have been highlighting an unsustainable growth through spiraling debt dynamic. Steve Keen, in a series of direct challenges to Paul Krugman, has zeroed in on Keynesian neglect of this force in formal macroeconomics and macro policy.
Looking beyond strictly the public debt levels cited by many, as of 2007-08, TOTAL debt to GDP ratios (summing sovereign, household and non financial corporate debt) for the US were reaching well beyond the 290% figure seen at its prior peak from the early 30s. And we are still above 350% today. Some analysts have estimated aggregate debt to GDP at 400% for the planet as a whole, with levels more than double that for the UK if financial debt were also included. If these figures are correct, we are reaching the limits of inflation (money plus credit) and debt saturation. In this fiat money system, they are flip sides of the same coin. Since these can’t easily grow substantially further, deflationary pressures are building instead. Current debt totals measure future income that has already been spent, and can’t be spent again. For now, total debt is still not declining, as sovereigns in stronger nations have been able to roll over and even increase their borrowing at very low rates, as have corporations via share buybacks. Arguably, total nominal debt could continue to grow as nations pursue competitive devaluations. But in real terms additional debt is crowding out real growth rather than propelling it. That is the message central bankers have yet to acknowledge publicly if they are conscious of it at all. Dramatic changes to the monetary system are ahead, but a violent storm will come first. Most have no difficulty acknowledging that much of the public debt will never be repaid, but few seem to recognize that if push comes to shove, the creditors on the other side of these positions are holding trillions in ultimately worthless paper. Consequently, real global wealth is vastly overstated. Once the tide begins to recede, this will become evident and gold will not be immune.
pedro_deleon
sounds like a 800 pound gorrila in the room
Wow…Welcome to Goldtent pedro_deleon
are you related to Ponce ?
🙂
I have been know as the resident long term chartologist here by posting 25 / 40 year monthlies occasionally
But YOU are now the Resident VERY LONG TERM CHARTIST with this very interesting piece of work
Thanks for posting here and for persevering to do so in spite of our difficulties presently
This post is save at the sidebar for all members to access at a click any time
Highest Regards
Fully
PS: $250 to $500 Gold will not endear you to the Gold Bugs !
it’s easy to dismiss Elliott Wave theories because of Robert Prechter’s Elliott Wave predictions and whose “newletter’s timing advice for traders is in last place performance over the last 20 years among all stock market timing strategies tracked by the’Hulbert Financial Digest’.” (This quote from CXO Advisory Group’s article on Robert Prechter called “Robert Prechter: 100-Year Bear?”
Like every discipline there are good ones and poor ones and sometimes they interchange over time
mark said it best….adapt
This thesis though sure is food for thought