What Drives Gold and 2011 vs. 1980
I wanted to chime in with some info on these subjects. I’ve covered them in my book…
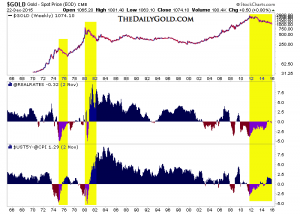
The #1 and major driving force for Gold (and hard assets in general) is declining or falling real rates. Armstrong’s “confidence in government” is incorrect. Confidence in government is near all time lows yet Gold hasn’t gone higher in recent years. It is all based on negative or falling real rates. Note that real rates have increased in recent years. Thats the fundamental cause of the bear market. Not manipulation. See the chart below where I plot the real fed funds rate and the real 5-year yield.
I don’t show back to 1915 in that chart but rates were heavily negative in the 19teens and 1930s and 1940s, coinciding with the bull markets in hard assets then.
In regards to the 1980/2011 comparison, one needs to look at the data as it paints a clear picture.
First things first, there is a fundamental difference. Then, real rates surged, killing the bull market as the Fed raised rates aggressively and inflation declined. Global government debt is so huge that no one can afford a replay of that. Just not possible and thats why Gold remains in a secular bull. It has been in a bear because real rates have increased but that is not sustainable. Either inflation picks up (its starting too actually) and the policy makers let it run or global economy falls into recession and we get negative rates and huge government spending, etc. Either thing will drive the recovery in Gold.
In my book I discussed how in 2011 Gold was on the verge of going parabolic or would have to undergo a severe bear market before going higher later. Its easy to say now but it was quite clear then when I put Gold in 2011 on the same scale as previous bubbles. 1929, Japan, Tech Stocks and Gold in 1980 all went parabolic then crashed 70%-90% in 2+ years. All followed a similar pattern. Gold is down 45% in 4+ years…thats not how a secular bull market typically ends nor how a bubble collapses.
Back then Gold went up 25-fold. Recently less than 8-fold. Gold went up like 4x in the last 15 months. Gold didn’t even double in its last 15 months this time around.
Here is a linear chart of the two bull markets on the current scale:

This bear has been someone similar to the 1974-1975 one in that Gold was long-term overbought and came back down to trend before going parabolic. Also the trend in real rates in recent years compared to 1974-1975 is very similar. Real rates went from negative to 0 or slightly positive but came nowhere close to the surge after 1980 AND seen in 1920 and 1951- the secular tops in the CRB (but Gold was fixed).
Another thing I discovered in my research is the Gold/Stocks ratio has made secular peaks every 38-43 years. If I take the midpoint of the dual peaks during the GD (1934 and 1942) I come up with an average of every 41-42 years. That puts the next peak possibly in 2021 or 2022.
Shameless plug, you can get my book for free at thedailygold.com/book and I’m also working on another update.
Edit- Oil went up nearly 15x from 98 to 08. That is about twice what Gold did…Gold would have had to go nearly $3500/oz to match Oil. Nasdaq went up for 25 years, tripled in the last year or so and was up way more than Gold when it peaked. Not even close.
Thanks for weighing in Jordan
You make some excellent points .
There are PARABOLAS and there are parabolas
THEY ALWAYS END BADLY …UNLESS YOU CAN RECOGNIZE THEM IN REAL TIME AND BAIL APPROPRIATELY
Don’t worry about “plugging” your work . Your work is always enlightening and welcome here .
What do you base your sentiment “Confidence in government is near all time lows….”? How is this measured to support your assertion? I don’t have an opinion either way, I just wonder what allows you to say that.
Take a look at the chart in the link. “Trust” correlates fairly well with Gold but not as well as real rates.
http://www.people-press.org/2014/11/13/public-trust-in-government/
Here is another chart but it shows confidence (Armstrong’s word) at lows in 2014
http://www.trbimg.com/img-53b1c742/turbine/la-na-g-confidence-us-government-20140630/650/650×366
Nice….thanks for response.
I don’t believe these polls of public trust in government. People worship the government. It is the hand that provides all, more now than ever. They are just not satisfied that the gov’t is handing them out enough goodies. Also, it depends on whether it is public trust in govt’s honesty or competence. It’s kind of a meaningless stat in my view.
Trust in Government as defined by Armstrong means Govt Bonds .
This chart also seems to have an inverse correlation with gold.
Maybe something related to economic confidence?
(click max)
https://research.stlouisfed.org/fred2/series/BAMLH0A0HYM2
I know who Bob is but who is Fred ?
I wondered if it was Jordan.
The second chart showing the two gold bull markets, maybe it needs to be deflated by the CPI or some other inflation measure. Then you would have real rates and real gold. The 1970s bull market is somewhat exaggerated by the high inflation bumping up the nominal price of everything (except the Dow!)