Re-visiting old chart with gold target of $780.
I never posted my gold bear market chart with the $780 target, not even on my own blog, so here it is. I cannot update this because I no longer use this particular charting service.
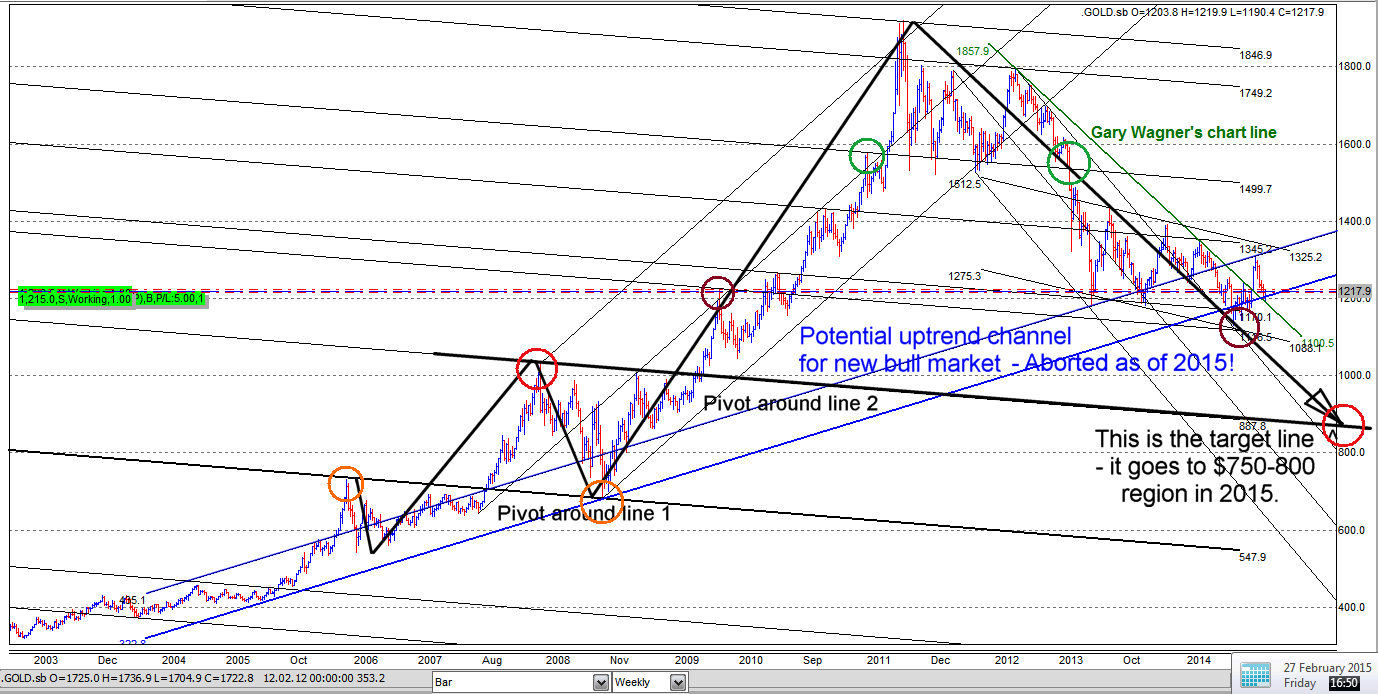
I regarded the $730 high in 2006, the $1030 high in 2008 and especially the $680 low in late 2008 as key points to try to draw median lines of some kind. I noticed a pattern where the impulsive move up to $1920 in 2011 is a larger version of the impulsive move to $1030 from 2008. On that score there is a possible target of $780 for gold, depending on the time-frame, since the target line is sloping.
My estimate of the date for this low was perhaps in 2015 and here we are. I wonder if we will get there? This chart was drawn in early 2014 and was not meant to be scientific, just visual:
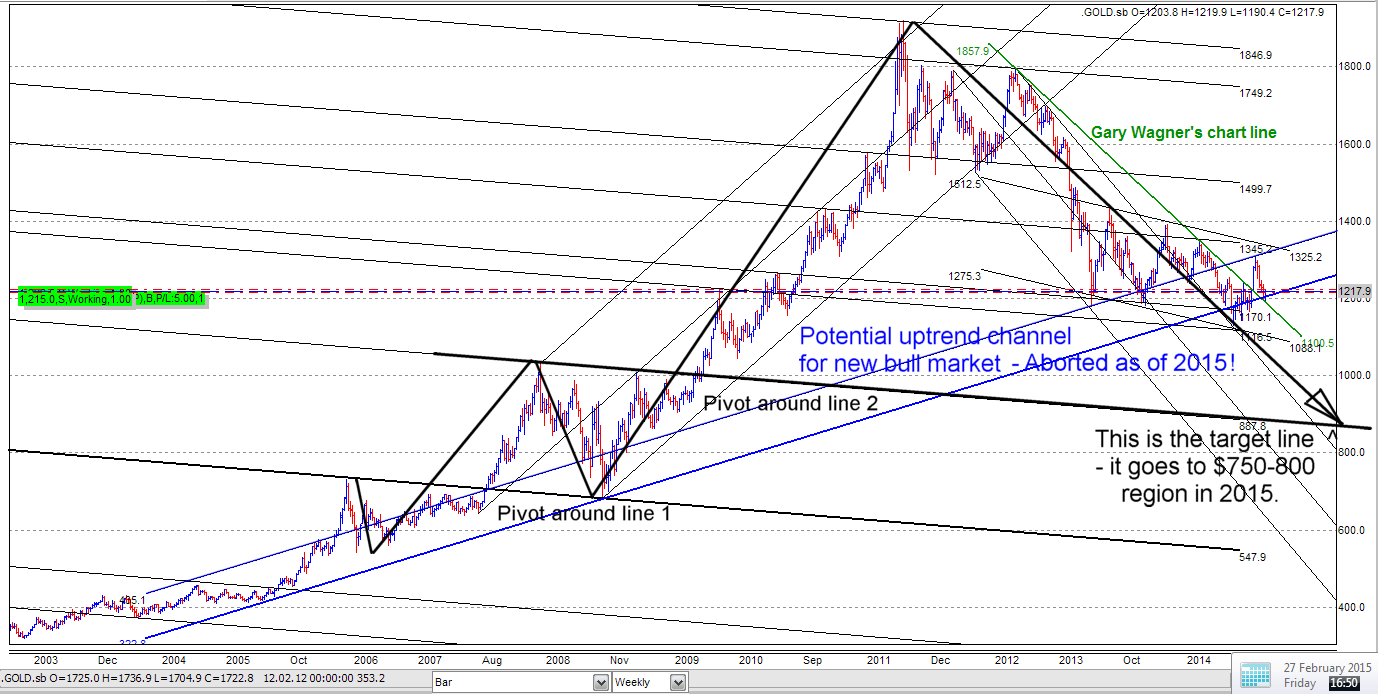
or with circles: