Spooky : Is this the Bottom ?
Two months ago I adjusted my ultimate bottom PO to be 66 in the HUI. If I had to guess when I would say possibly in the spring. I dipped a toe in the water today buying a few of the better looking PM stocks thinking we could be set up for a bounce here. I have stops in below the recent lows. So a rally from here then a violation of the current lows would be my most favored scenario,
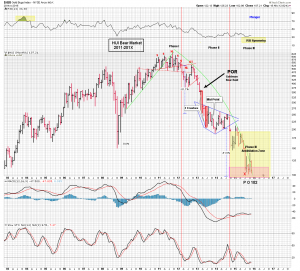
Having said that, I was cleaning out my chart file and ran across this chart of the HUI that I originally made in May 2014 once it had built its consolidation diamond. I post it here unchanged since then. Of course the price action is automatically updated to today. But the yellow annihilation zone is unchanged since then and was totally blank at that time. We hadn’t actually entered the zone yet. I got the PO from the H&S BO to BO method. It was measured off the May 2014 bar which is slightly too early as it was a forecast and had not broken out yet. It finally occurred in September so it needs slight upward adjustment. With that adjustment made it would perfectly nail the bottom here now. The X was the original forecast bottom. Kind of spooky and makes me wonder is this the bottom? Since I drew this chart we have had 2 additional crashes (not colored yet). One can see we are smack dab in the heart of that target PO zone. I even colored the extreme bottom red when I made the chart 18 months ago….look where we are now. When this was drawn the HUI was around 225 and an ultimate HUI target of 102 seemed simply ludicrous. In fact this was the first chart we published out in the public media and it was met with universal derision. Fools they called us.
So I have to wonder, did we actually nail it way back then? Don’t know only time will tell, and todays action was pretty ugly. But maybe my sixth sense kicked in by dipping my toe in the water today. It may be worth a small shot at least. I am keeping stops tight.
GG has a 4 month positive divergence
“So a rally from here then a violation of the current lows would be my most favored scenario”
That’s how I have it.
With gold making new bear market lows this past week you would think the miners would have broken down a lot more than they did. The miners look to me like they are establishing a bottom, with the last of the weak hands selling their shares. The value investors are coming in to buy these things on the cheap.
Weekly DUST hitting trend line with a spinning top for the THIRD time. Usually portends a change. Good luck Plunger..
http://stockcharts.com/h-sc/ui?s=DUST&p=W&yr=2&mn=0&dy=0&id=p58268774424&a=389304413&listNum=1
http://stockcharts.com/h-sc/ui?s=NUGT&p=15&yr=0&mn=0&dy=10&id=p69076203389&listNum=1&a=418949985
Good job Plunger…