Phase III Annihilation
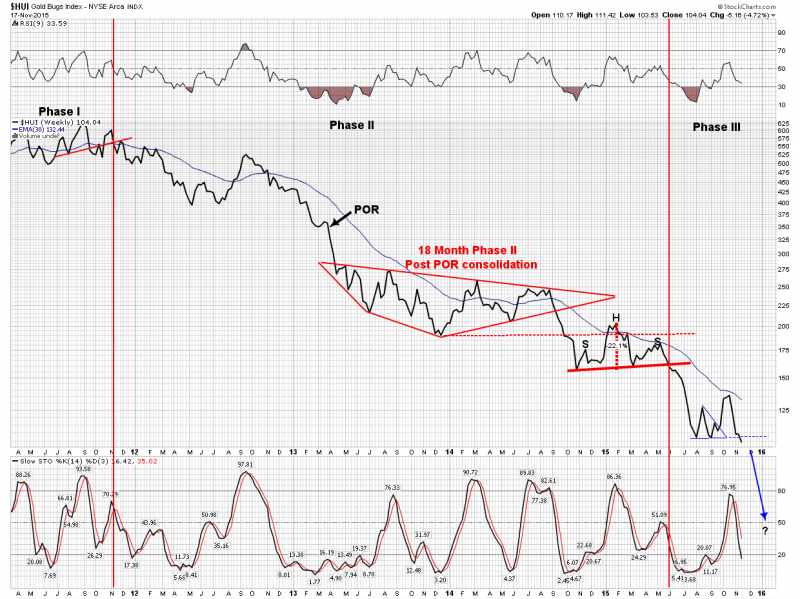
Here are some big picture gold bear market charts. My gold bottoming system is still pointing for lower lows. This is NOT the bottom. If we crash however I will buy into it for a bounce. Its pretty clear knights we are in and it feels like liquidation.
We have never had this dynamic yet in this bear market. Days after days in a row of grinding selling. The step sum has pointed this out. This is phase III action which was writen about two and a half years ago. It was stated to look for this to identify the end. Well here it is. Its upon us now. We are in the end game. Paraphrasing Churchill, its not the end, but perhaps the beginning of the end.
Here we are entering Phase III annihilation: (click on charts 3X to enlarge to the max)
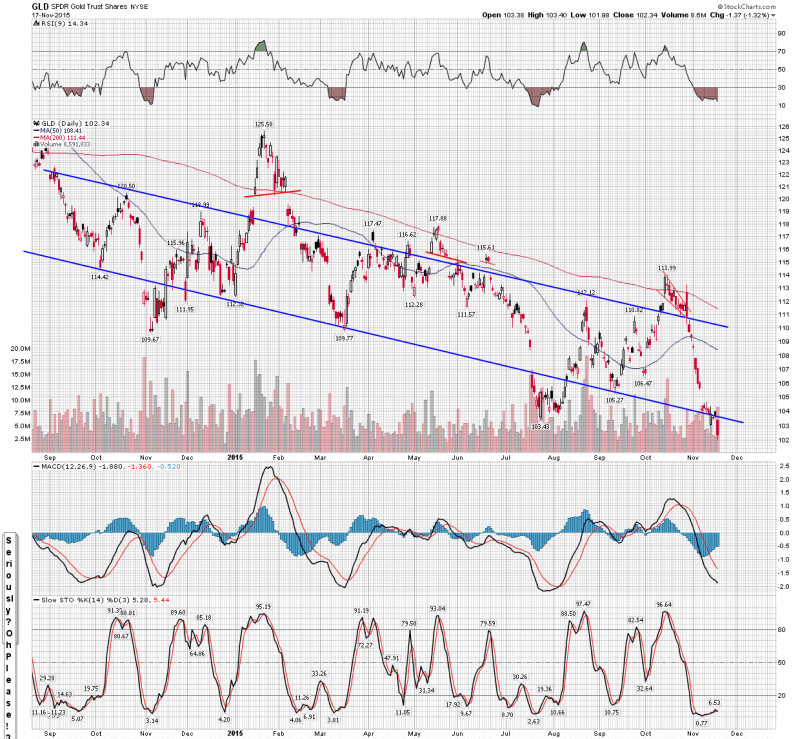
And the trusty trend line of GLD is performing its task of showing the two applicable S&R lines. Today was instructive:
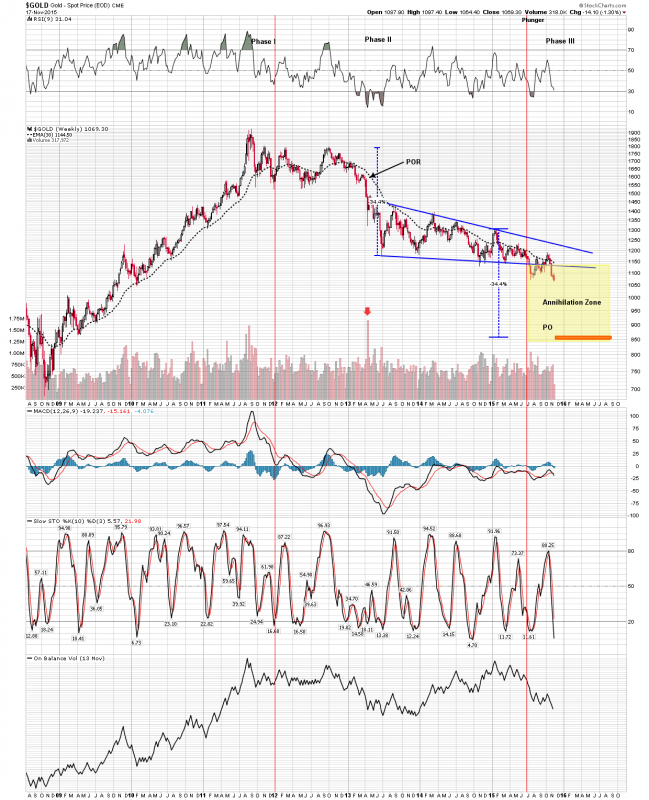
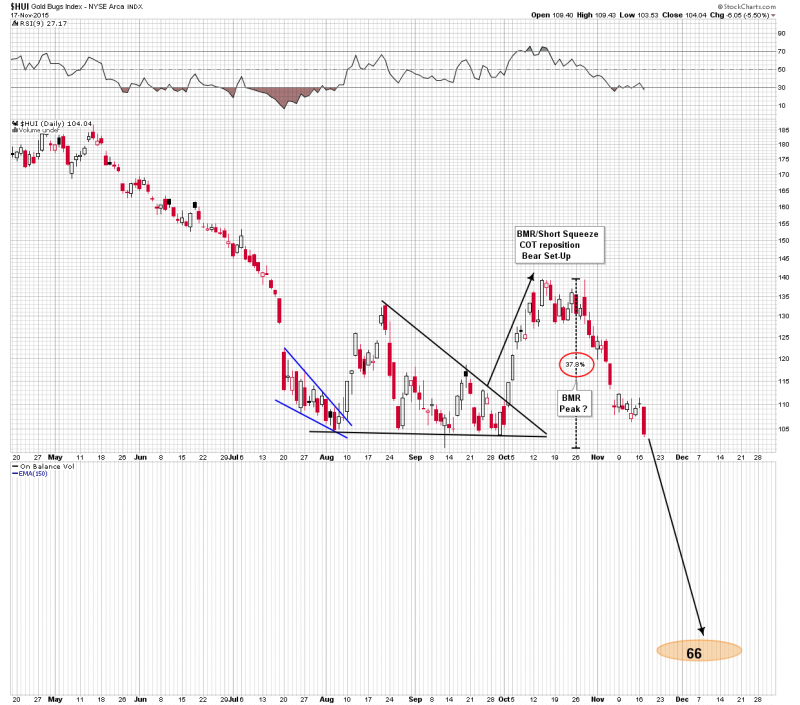
Here is where we have been and perhaps going…Its been a long and crazy trip Jerry Garcia:
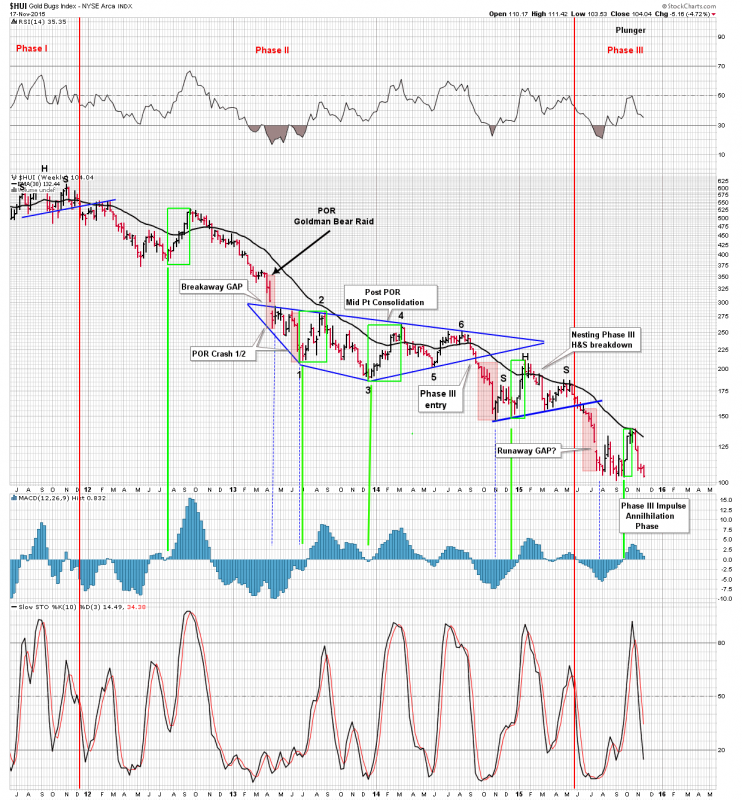
Recall way back when I described phase III action as no longer able to sustain true BMRs ( Bear Market Rallies) any more. Instead we just get violent short squeezes. This previous one in October pretty much fits that description, although its a bit of a hybrid. Being the first one in phase III maybe the rest will be simple v-shaped vertical wonders lasting less than 2 weeks.
And finally take some time to study this chart. Note the green vertical lines drawn. They are drawn from the launch point of each of the BMRs we have had in this 4 year cascade. They point to the MACD histograms indicating the momentum of the market at the time of the beginning of each BMR. The significance is the BMRs occur when the Histograms are positioned to start an ascent or a rise. For that to happen now the market would have to totally reverse the downward momentum one can see now. Not likely to happen, as we have just finished crushing the early bulls who jumped on in this last short squeeze in October. Its has been an epic flameout after that 3 week rally. Is it likely they are willing to step up to the plate again and risk another drubbing? So this chart argues for lower price now, not later.