Apple
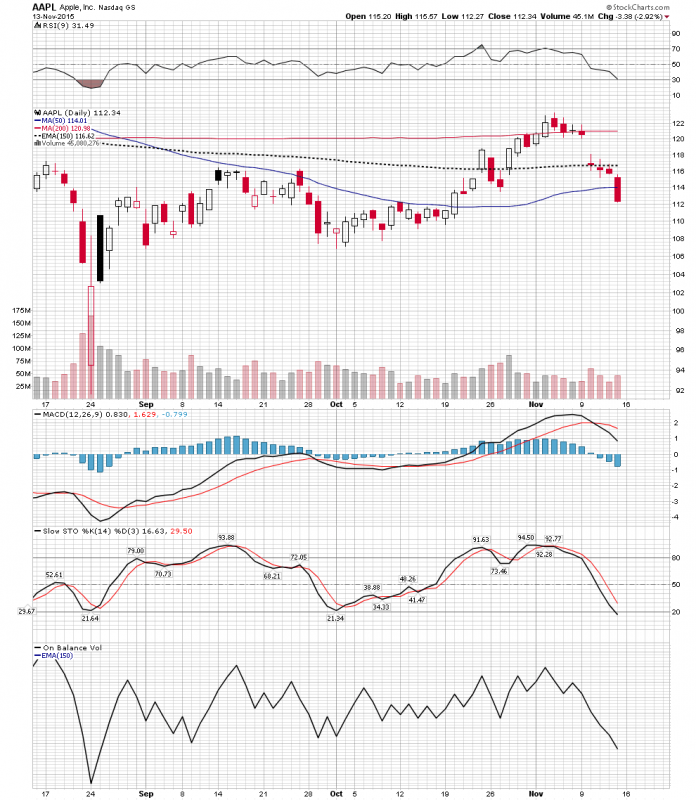
IMO of course. The market is speaking to us here. Here is the market favorite…Biggest…and the most worshiped stock in the universe. And its squawking and talking that the market is headed down. Look at the interplay with the moving averages. First it can’t breath in that rarefied air above the 200 DMA for more than 4 days. So it pulls back (with a gap) to the next defensive position the 150 DMA (30 Week proxy) Note the Doji candlesticks. Then we had 2 days of BT hugging on the underside then it gives it up with conviction slicing through through the 50 DMA as if it was not even there.
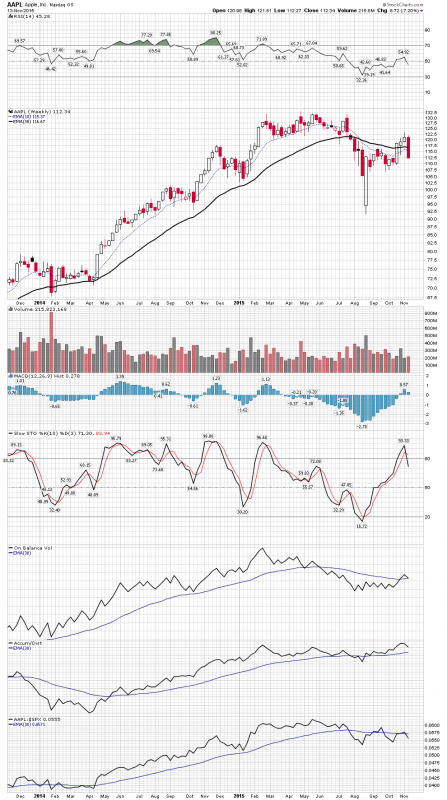
Next the weekly, Its easy to see the stochastic rolling over but here is the unique insight I have to offer. I talk a lot about the 30 EMA and how I interpret it. It’s like a yield curve it delivers a prophetic message if one learns to read and analyze it. Here is what I see. Looking at the 30 EMA we see it peaking in late July. We got the August smash then the retracement which caused the 30 EMA to gently dish out and attempt another peak. That second peak is now going to fail and roll back over. We have a double lower top in the 30 EMA which is very powerful and tells you where the trend is headed
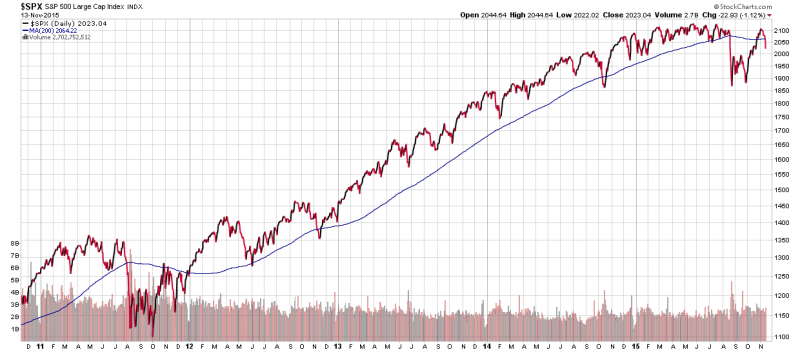
Now look at the SPX
Count how many times the S&P after rising back up through the 200DMA after a correction has then fallen back down through it? Answer: Zero until this week.
The two largest retailers Macys and Kohls are also in a bear market.
^ See Nordstroms Post Earnings.
Also, Wal Mart forewarned us months ago about slow sales.