SDS Monthly …. support for the BULLISH market case
There are some uber BULL counts out there.
Like most others here, I REALLY want to see the 2000 and 2007 patterns echoed with a fierce drop from the 20mo MA. Its BEYOND time for that.
But I can’t ignore what my own charts have been saying, particularly since PRICE has been even more emphatic.
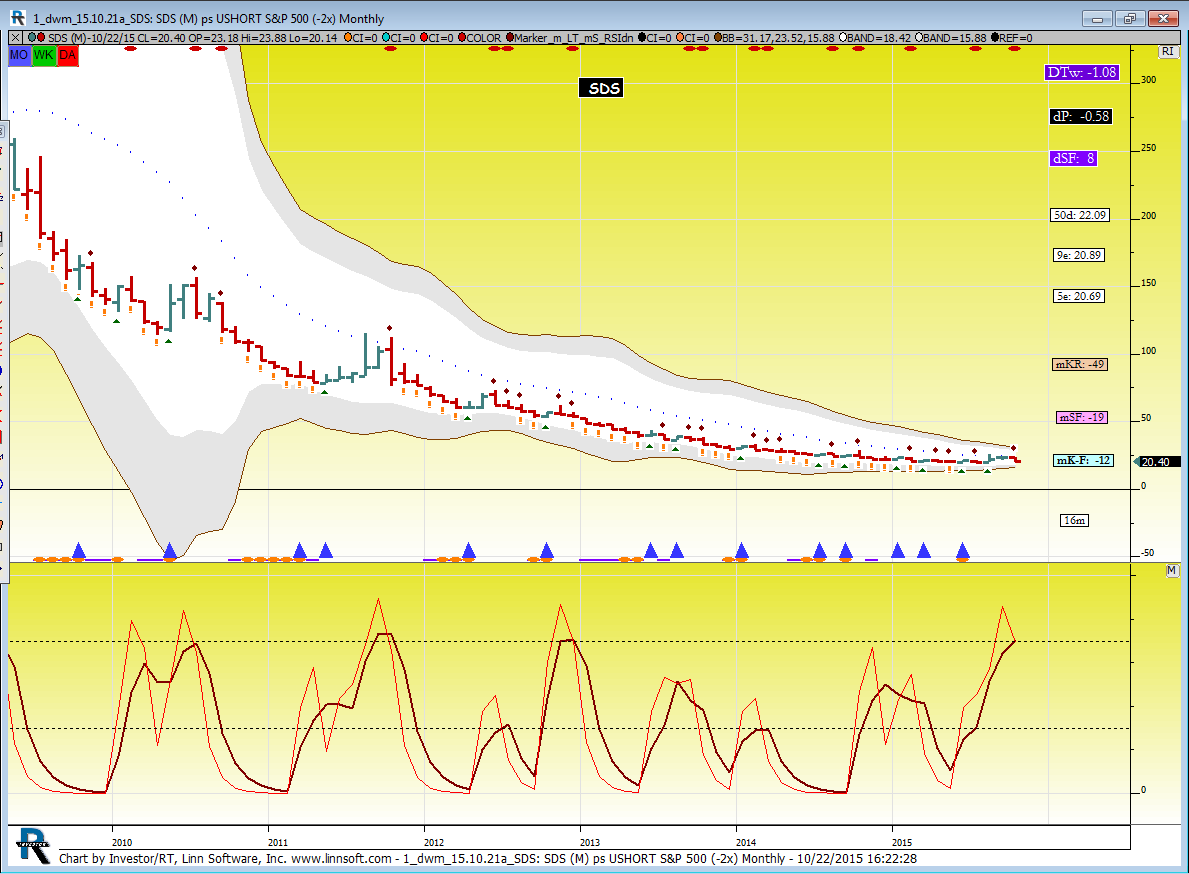
This is a chart of SDS monthly, with one pair of fast tuned money flow measures.
Compare summer 2010, autumn 2011, and late autumn 2012 with the present.
Then see what followed in the prior instances. Six months (or more) of steady declines.