S&P and Dow Gartley’s
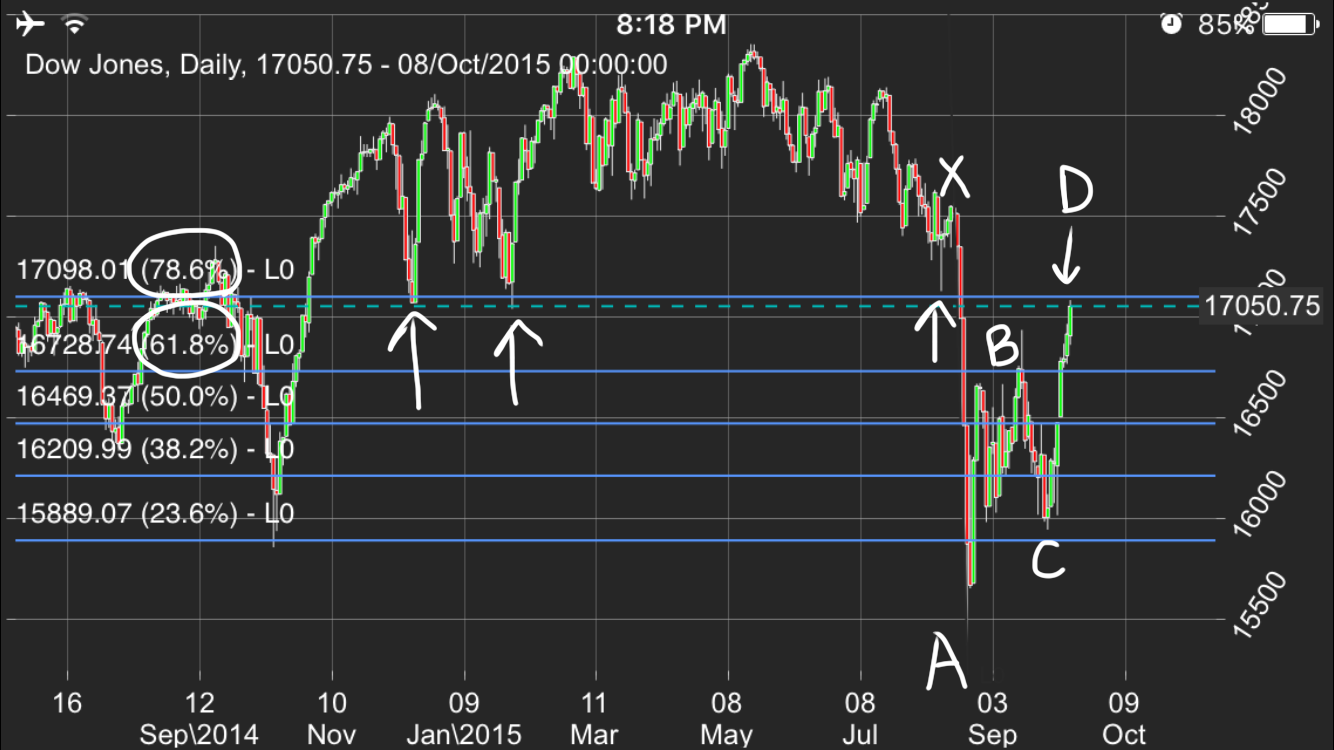
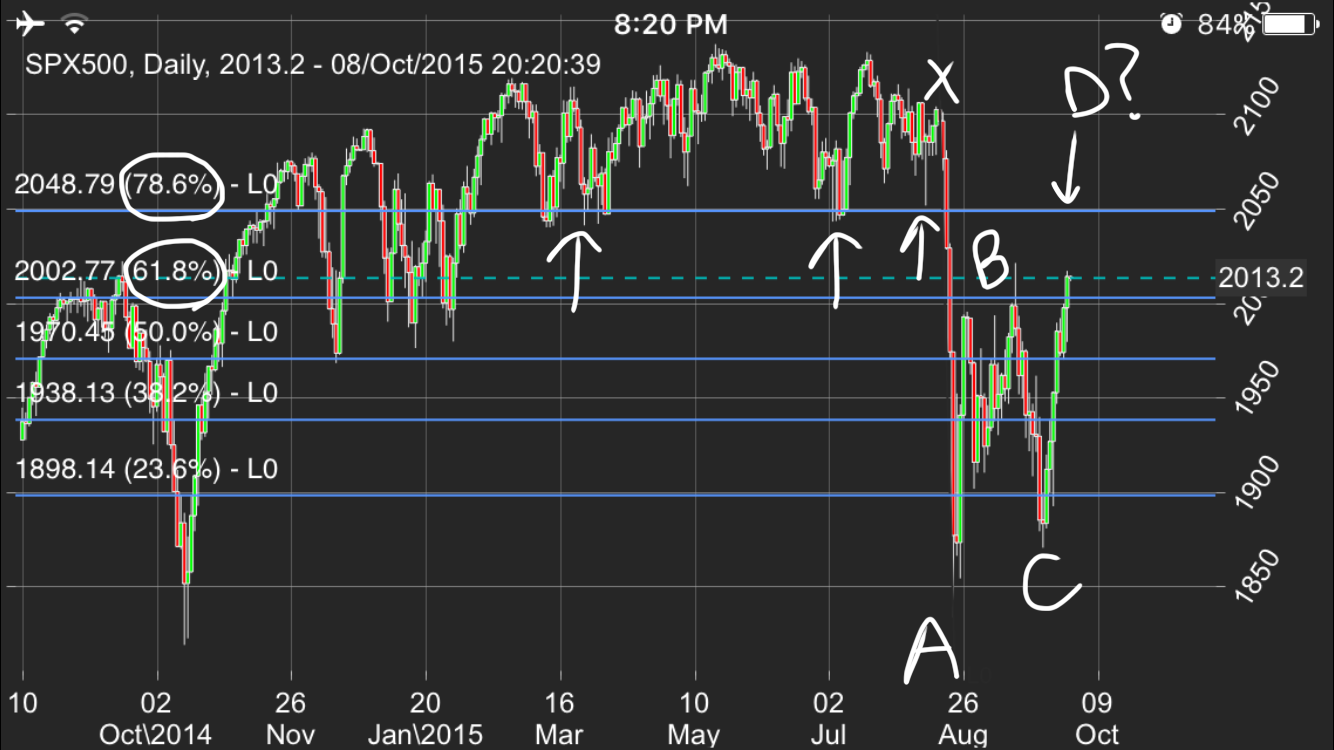
What I find interesting is that the Dow has completed its Gartley to the 78.6% fib retrace which interestingly enough coincides with the resistance shown by the arrows but the S&P has not completed its Gartley. If the S&P completes its Gartley, as the arrows show, it would hit the exact equivalent resistance as shown on the Dow chart.
i was expecting higher than s and p got today. i was surprised gdx sold off as it had been following the stock market.. that confused me a bit
on short term 240.. s and p is still bullsh
PC, Much would seem to depend on where “X” starts. If X is where you have it on the SPX, then the drop from X to A was 233 points (2100-1867)
If the move from C to D is 127% of the XA move, that would be 296 points. So 1880 + 296 = 2176 if my calculations are correct and I understand the Gartley formula (I may be very wrong but I just used the chart you posted below to calculate).
Mark, Does your Gartley or Butterfly actually conform to the formulas? Where did you place X and why? TIA
Never mind. Must have been looking at a Bullish Gartley. I should have taken .786 * 233 = 183. 1880 + 183 + 2063 which is close to your 2050 number.
Again, much depends on where X starts and how do you determine that.
Good point. If X is from a higher spot the Gartley could go much higher.
Notice the extensions through my 61.8% retracements. Seems to allow for some wiggle like all charting…
All that matters though are the 61.8 and 78.6 retracements though.
61.8 X 1.27 = 78.6 approximately.
Everything I’ve ever read from successful Gartley traders is that you shouldn’t worry about the exact precision of the geometry. They rarely trade that precisely w/r/t the fibs. As long as the general configuration if intact, it still has the potential to trade like a textbook Gartley. I look at other factors as well such where prices are relative to historic pivots and volume, divergences etc. I tend not to trade one single factor in a vacuum.
my problem is the arrow pointing straight down from here on another post.. im not sure that fits… the s and p can remain bullish on a decline without going straight down from here through the low.. there seems to be corresponding relationship with stock market and miners which did not exist before.
The correlation comes and goes. I’ve seen it over the years. It happened in 2008 during the crash remember?
http://charts.dacharts.net/2015-10-08/d1181.png
first pull back area.. weekly shows a different story
1-2 up days from another top? What typically happens after the 78.6 is hit?
Well, either up and through like any failed pattern, and this ends up being a double bottom, or down like a textbook Gartley!