USD Cycle Chart
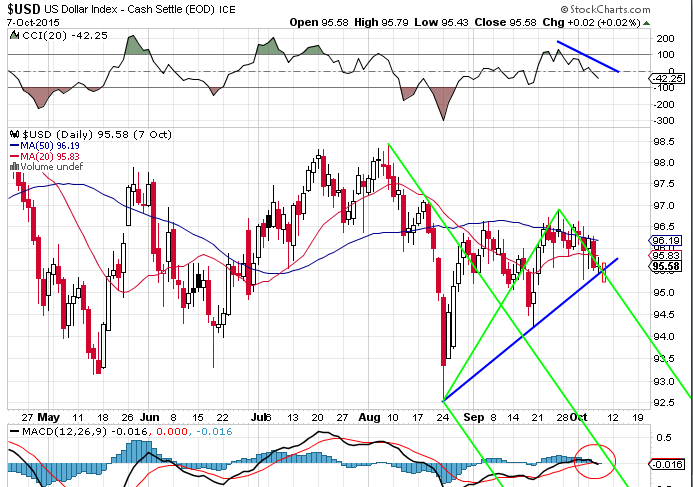
Here is my chart showing the Price action out of the last high for the USD. The green fork shows the current price channel and I have added today’s price action. Note how price has now broken down out the lower wedge line. This usually signals a move into a Trading Cycle Low (TCL). Note also the MACD cross and the downtrend on CCI.