Credit spread analysis- Markets on the road to resuming their decline. (edit- update)
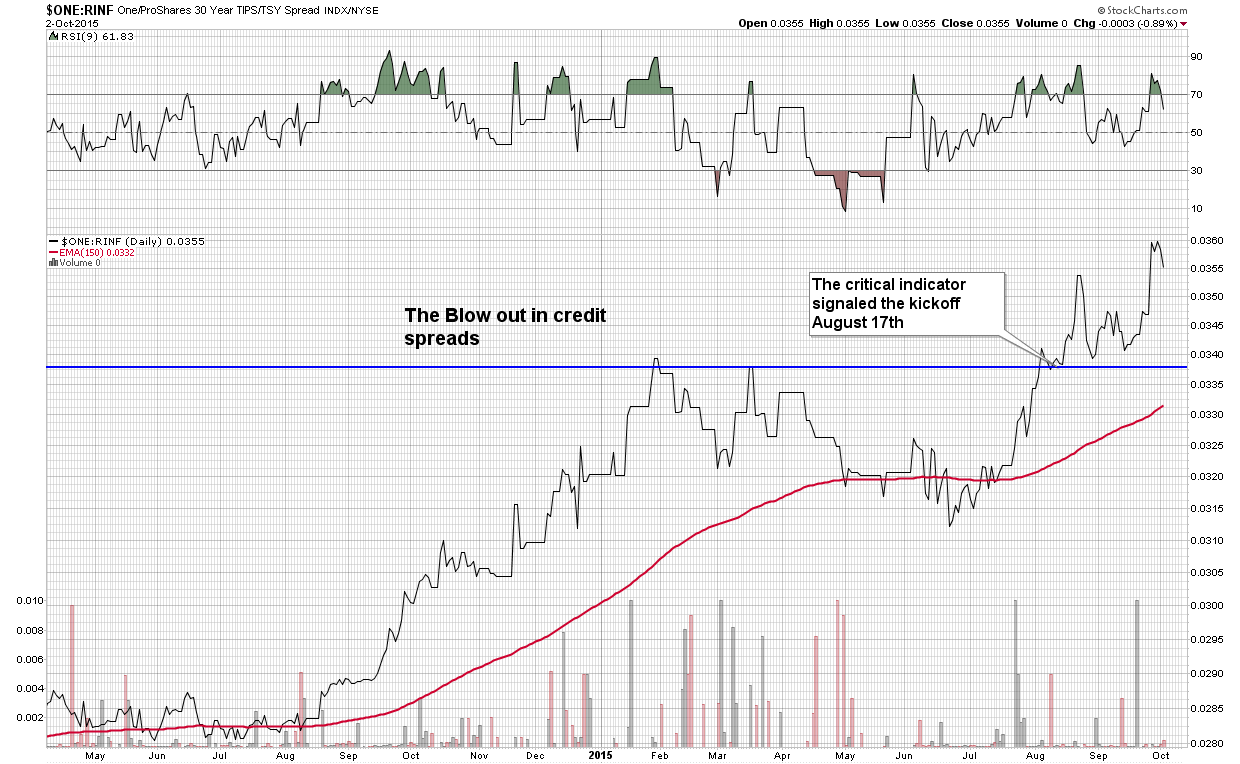
This post is a tag along to Bikoo’s post showing the JNK:TLT spread. My charts I believe are revealing the same. The markets topping and decline have been a multi faceted process. One of the indicators that has chronicled the process is the credit spread. Here is the vehicle I prefer to monitor this with. Note how this gave the indication that a collapse was coming. The early August break through of the old high then pullback and retest followed by the resumption of upward trend on August 17th. A one week warning to Black Monday. We now have the 30 EMA showing the trend is entrenched and we can expect a continued advance in the spread which should lead to a market dislocation.
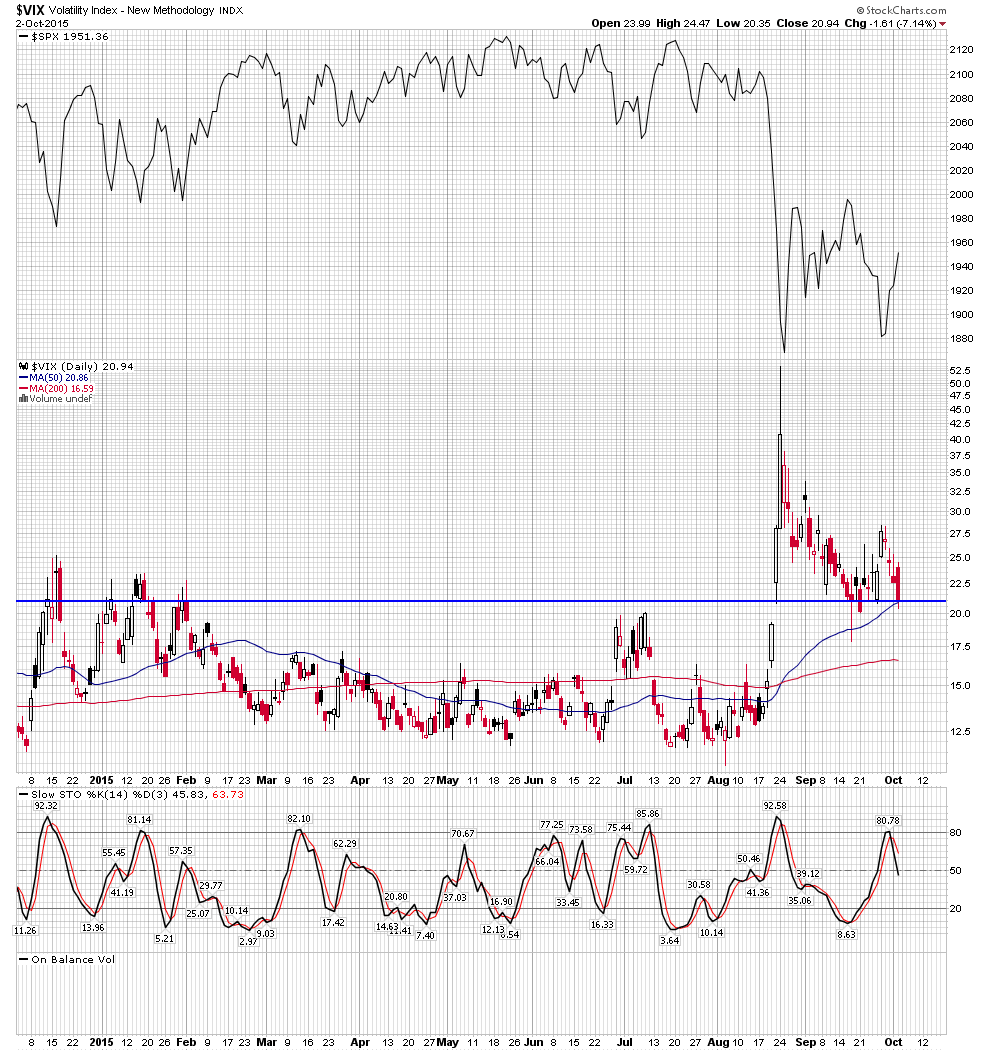
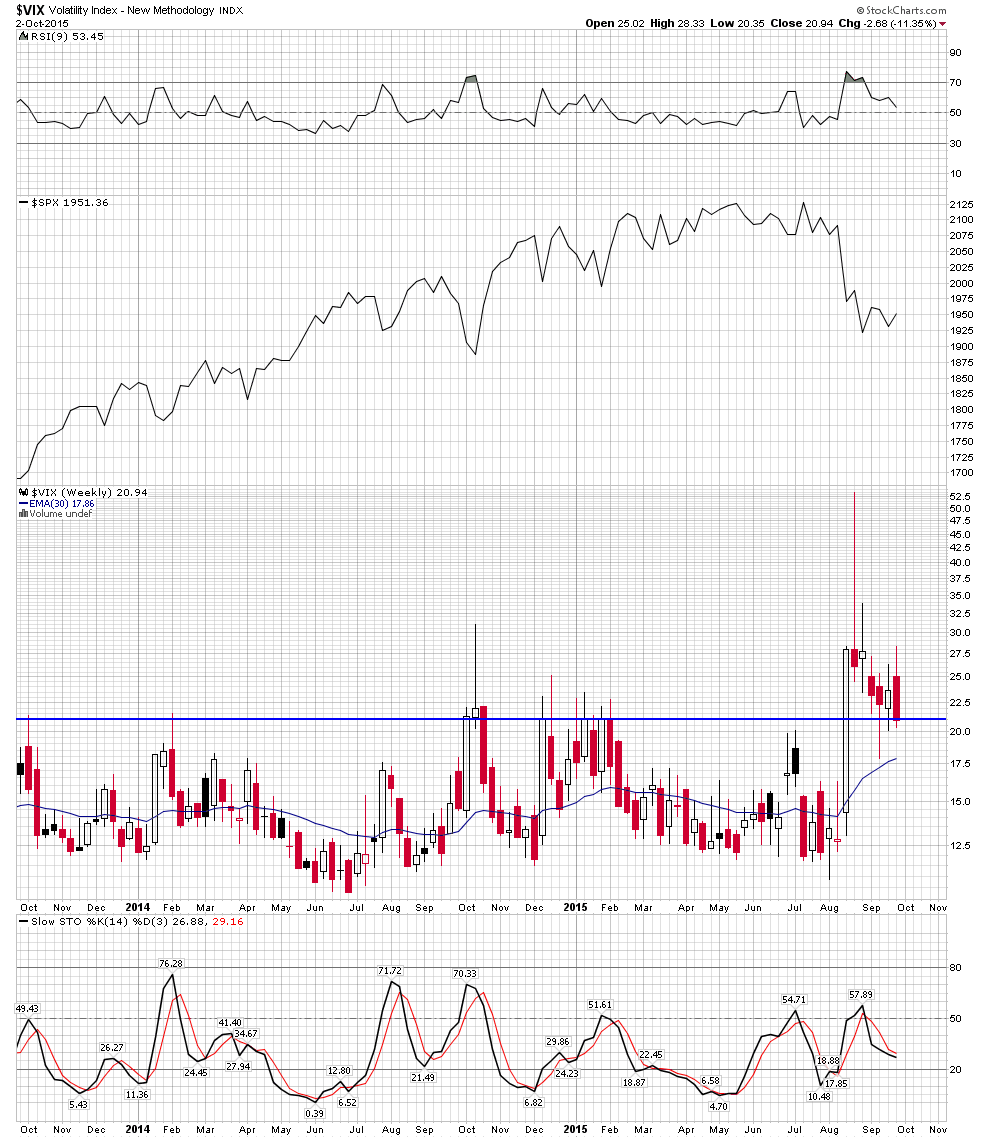
Now lets follow up with a review of the VIX. I will show the daily and weekly chart. The daily shows a pullback to its S&R line, with daily stoch indicating it needs a bit more bottoming action, allowing the market to continue its rally a bit more. Next the weekly shows basically the same, yet with more authority. Here we see the weekly stochastics starting a turn. if it can complete it that will indicate a renewed decline in the market. Also note the 30 EMA of the VIX itself. It is configured in a strong upward fashion. If the VIX broke down through its support line yet stayed above its rising 30 EMA it would continue to be a bearish sign for the markets.
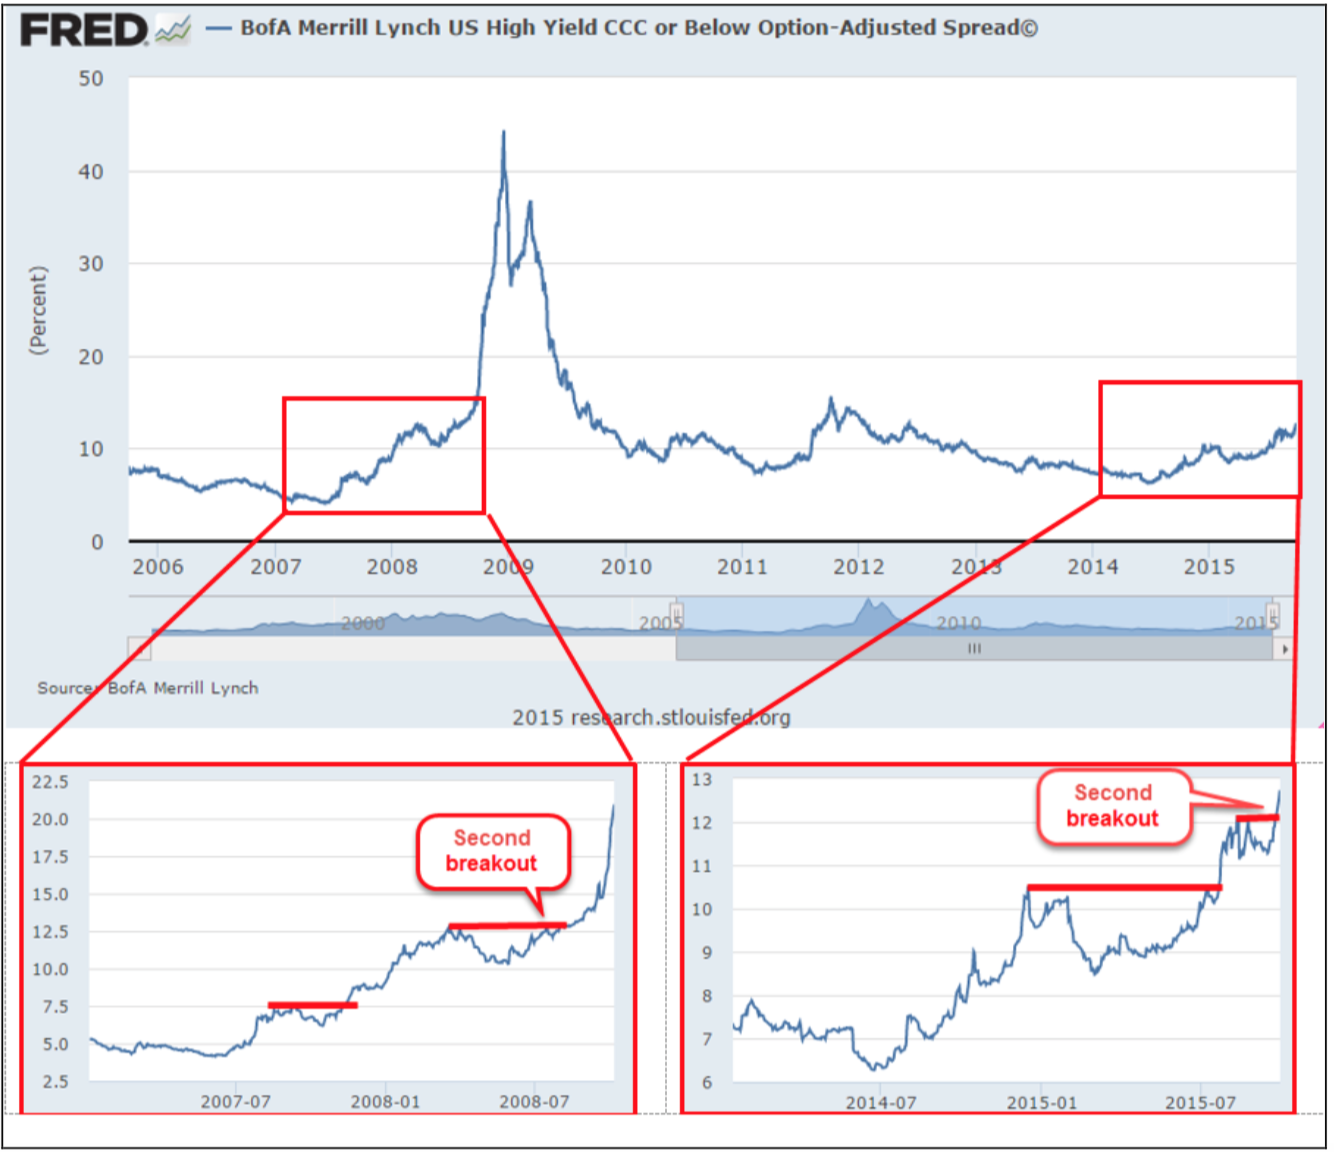
Now if I haven’t gotten your attention yet:
Looks like a bullflag/bullish falling wedge on the VIX.
The deteriorating credit spread and the margin clerks, will drive the markets now. Not the central banks. Most do not see it yet, as they hanging onto recency bias.
You have mail Spock
got it thanks
You have my attention Plunger
Wow…Thanks!