Altus- an update
Many of you know Altius is my largest position. Its been a bit of a rough ride the past 3 months, however it has remained intact and the theme is still solid. Nothing has changed its simply been subject to the markets vicissitudes not anything associated with Altius. In fact it actually just gave a great signal for more accumulation to anyone watching the chartology. Let’s take a look.
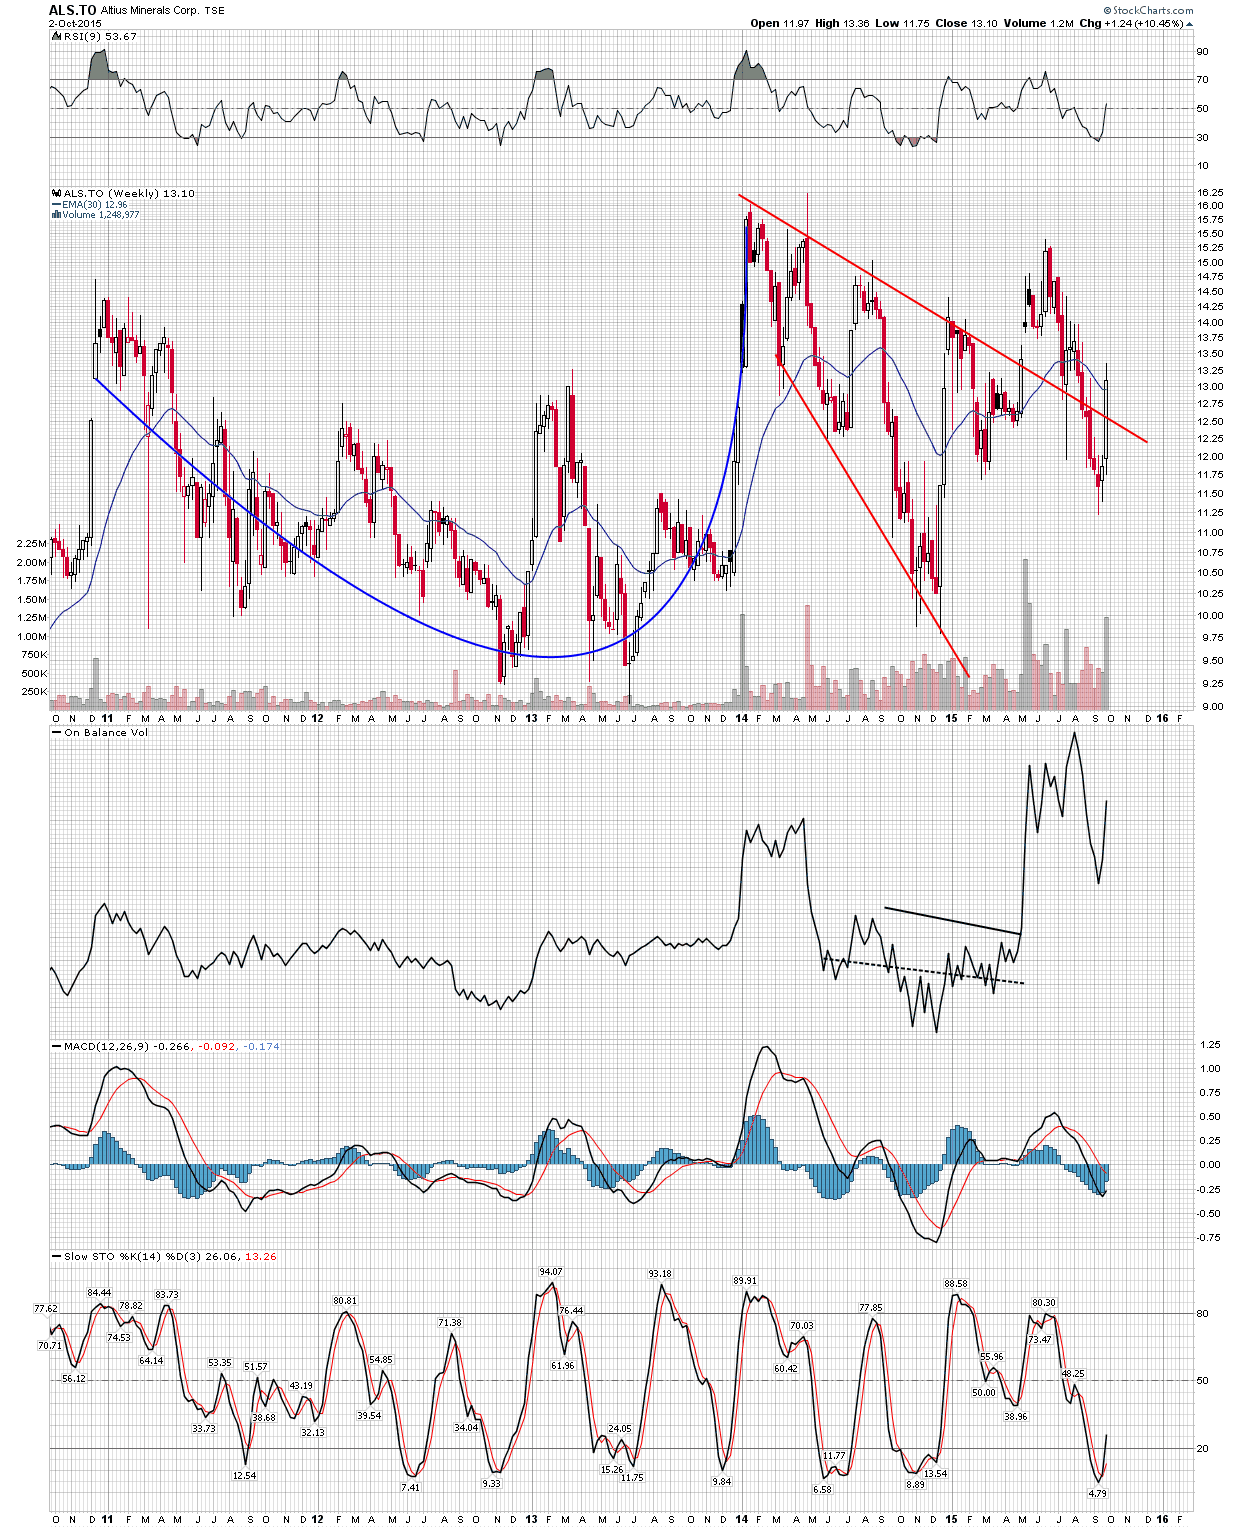
This first chart is my concept “cup and Handle” which I have identified and mentioned before. It has been such a nice set-up, but recently it has tested my conviction as one can see it violated the current downward S&R line. However check out the other indicators. OBV was simply a retracement and now going back to where it feels comfortable (i.e.. pinned to the ceiling). MACD histograms are now shrinking back to zero. Stochastics turning up and in the process of breaching the 20% line which signals the all clear. Note also of course the resumption of volume once the uptrend has resumed. Finally, see how we have penetrated the 30 EMA, as opposed to bouncing off of it.
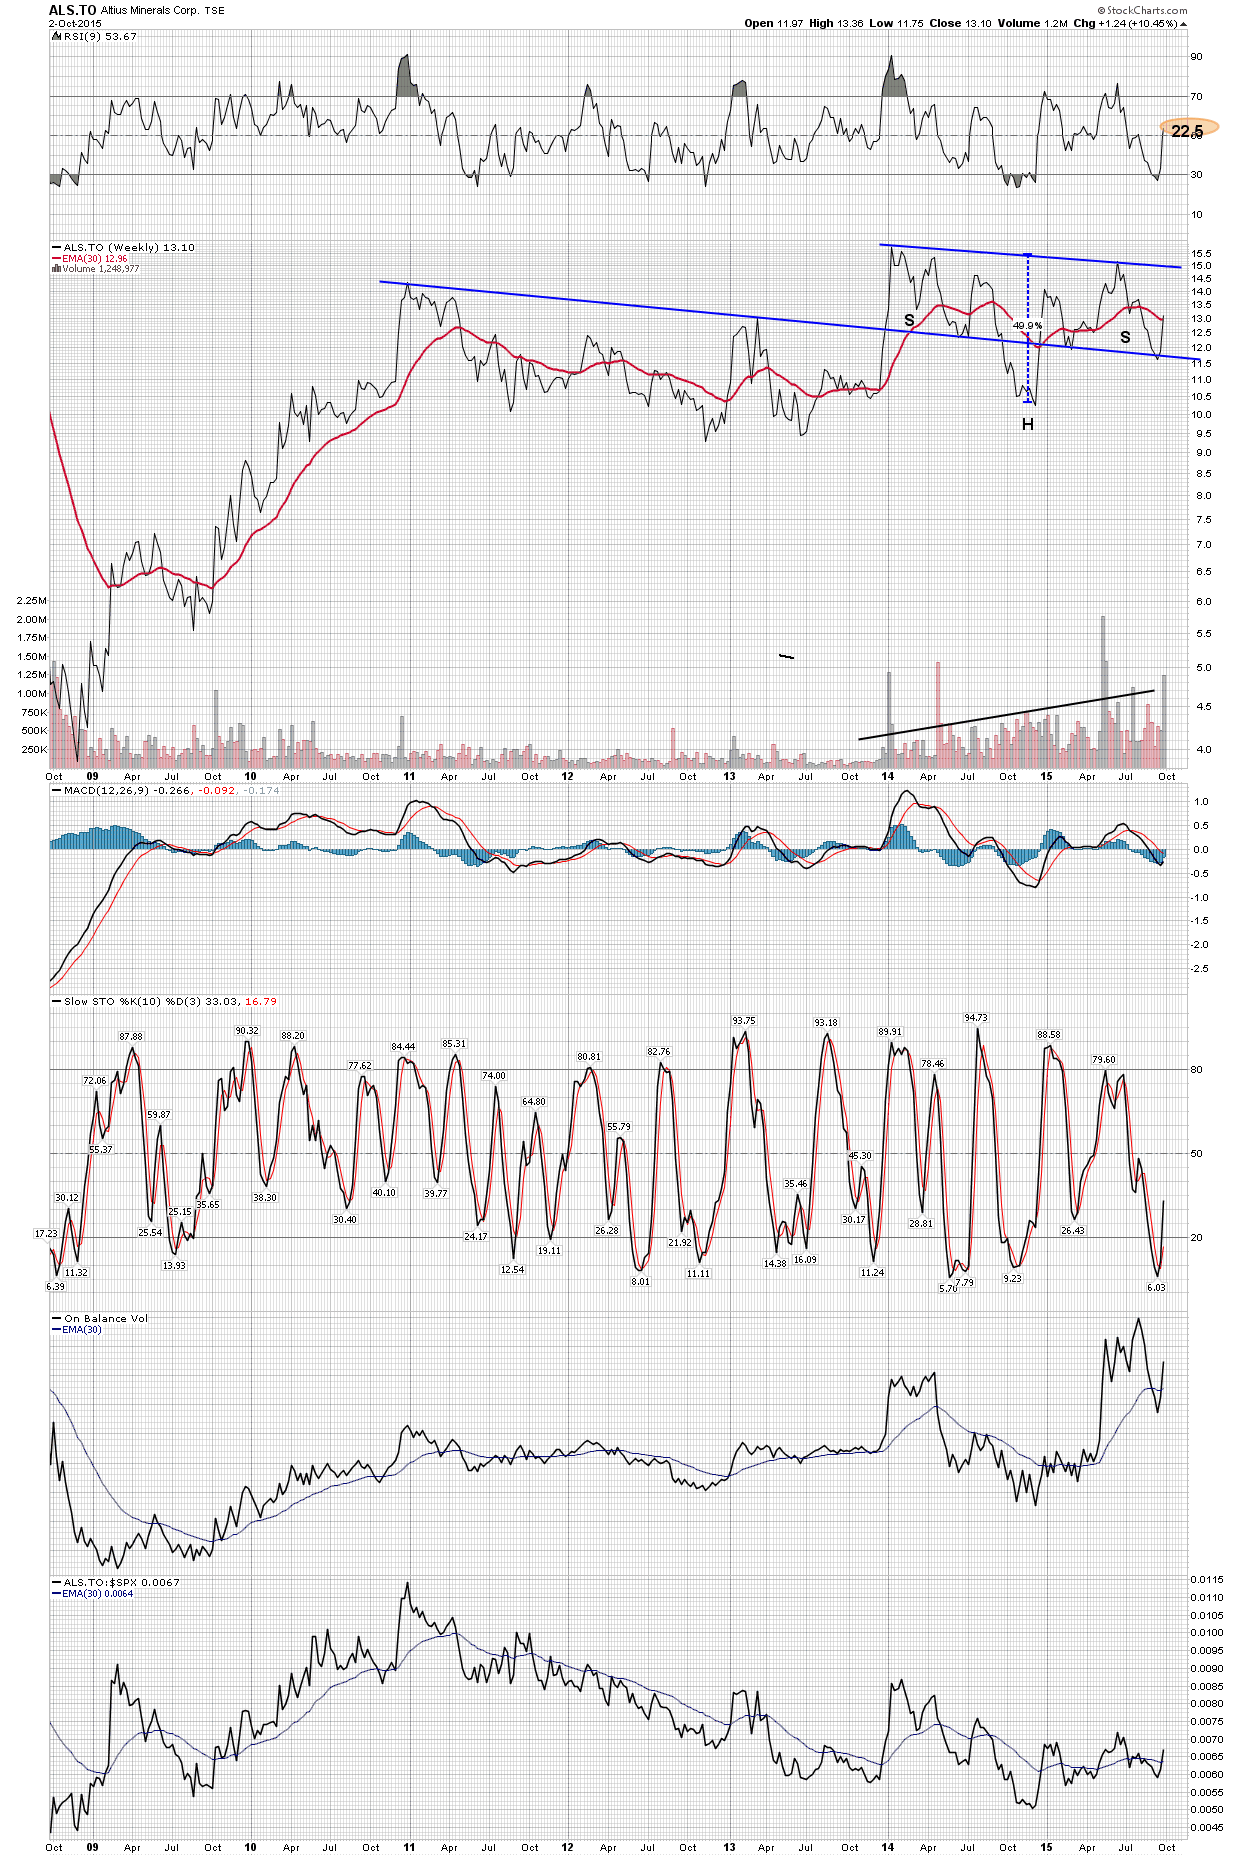
Now lets move on to the longer term weekly line chart. Now we see something really eye popping. This gives us a view from 30,000 feet and it reveals a very clearly defined inverted H&S. This is a beauty because of the long term S&R line cutting right across the chart for the past 5 years. Notice how it has acted as support to this latest move. This combined with the fact that stochastics made an absolute low right when we hit that Support line causing it to recover and turn up gives us a multi signal indicator. That combined with the other indicators of OBV, MACD and RSI give this a go ahead buy signal.
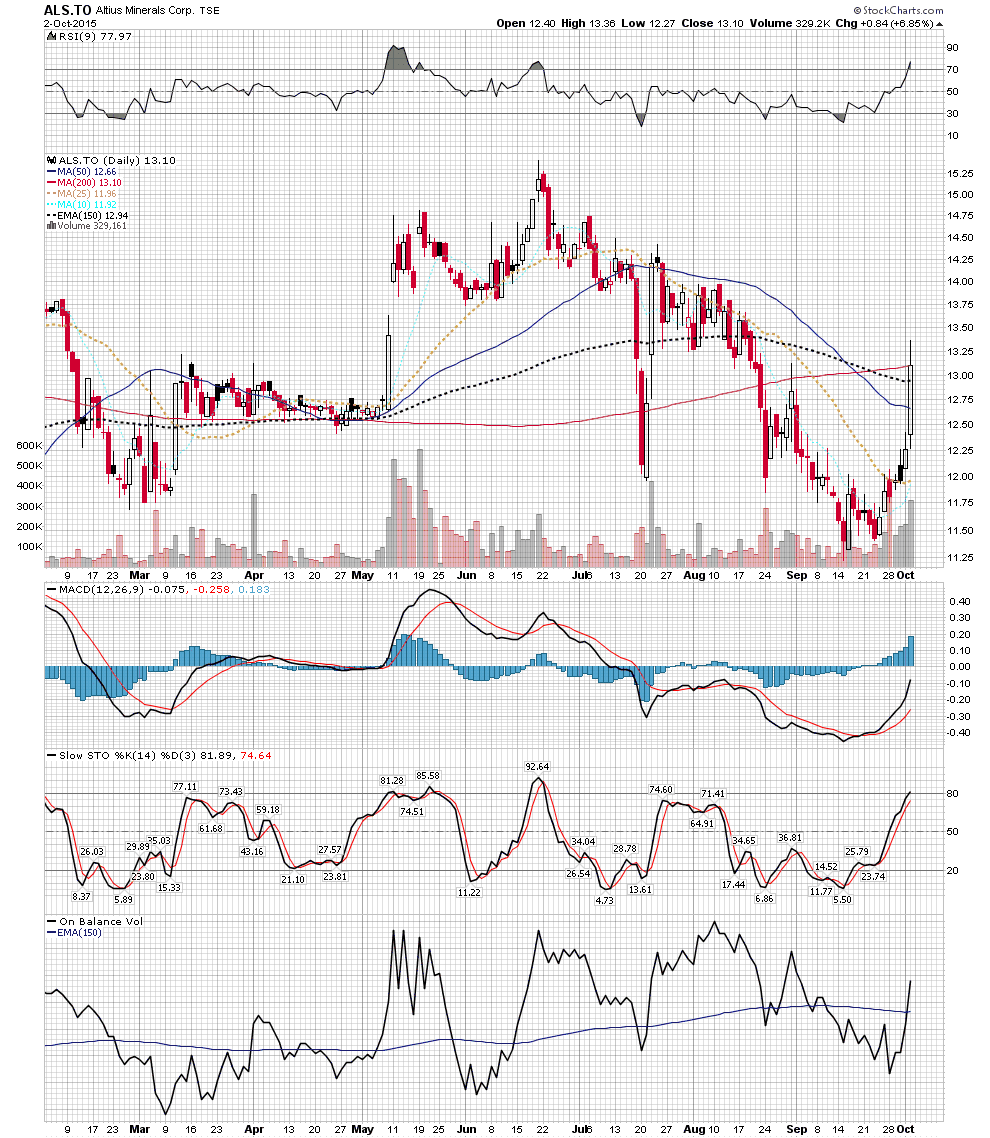
Now onto the simple daily chart below. We see how we breached the 150 day (30 W EMA proxy) with volume. This is a buy indicator. The next buy indicator will be for a further advance then pullback to the 150/30 then a renewed advance.
Plunger…remind me of the fundamentals on this one and why you like it
What do they mine ?
This is a royalty company…the don’t mine anything. Brian Dalton (CEO) is building out the portfolio of this company to model the production of the main mining houses (BHP,RIO,VALE,TECH) It has been in existence for 17 years and has gone from a mkt cap of 2.5 million to about 500 million. Its very conservative. Brian has recently finished up big block purchases of coal and Potash royalties. Now don’t think coal is bearish as the royalty is not based on the price of coal its based off of consumption indexed to the GNP of Western Canada. Altus owns 70% of the royalties to all of the potash production of western Canada. These are long tern assets….as in real long term (700 years) Altius is a core portfolio stock one buys and puts away for 20 years