Gold Cycle Update
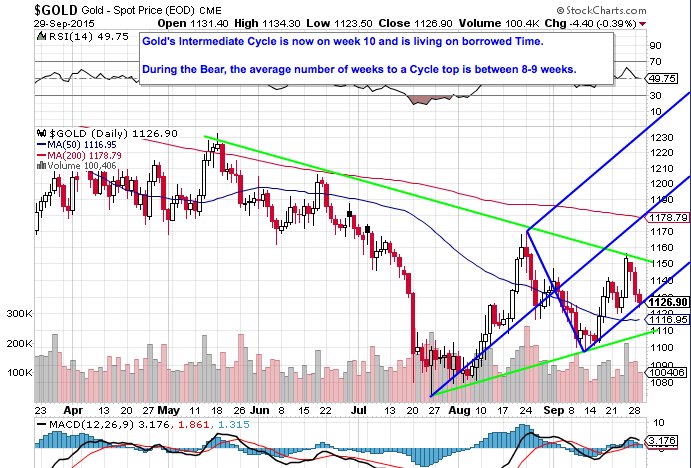
Gold is on in week 10 of the Intermediate Cycle (IC) that started in late July. During the Bear, the IC average to a top is 8-9 weeks so Gold is living on borrowed time. Intermediate Cycles last 22-26 weeks low to low on average so we should have another 12-16 weeks of downside action once my uptrend Cycle Fork gives way
The first chart shows a wedge (in Green) and my IC Fork in Blue. Note that Gold closed right on the fork today so it may bounce tomorrow or may not. Again Time is becoming a factor here given the history of the bear.
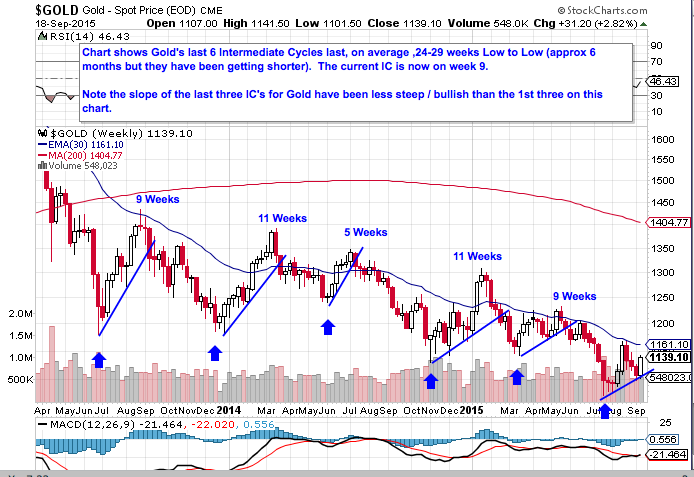
This second chart is a repost from last week and shows the IC tops and weekly counts since 2013. The Blue line is the Cycle uptrend line similar to the Green line in my first chart. I also use Forks as they tend to provide an earlier clue to the actual top before a trend line. Note that the slope of the blue uptrend lines is getting shallower over time, which is another sign that Plunger’s Phase III is beginning to take its toll.
Excellent Surf City
Class : Pay attention to Professor Surf
He is a cycles wizard . Cycles combined with forks…very interesting work