The Big Picture in charts
Let’s take a step back and look at things from about 25,000′. It helps occasionally to review the big picture dynamic and review the process. We are in a post bubble contraction which started at the peak of the credit cycle in 2007. The stock market actually peaked in 2000, by all measures (except nominally) however the actual economic credit cycle peaked in 2007. Since then we have been a fraudulent cyclical bull market powered by world CB credit creation. It has now gotten so distorted that the markets are rejecting the toxic medicine and in a state of revulsion. Since the beginning of the industrialized era these cycles have come along at 50-70 year intervals. So this is actually the peak of the post 1932 Credit expansion….pretty serious, can you say Kondratieff Winter?
In these PBCs (post bubble contractions) the senior reserve currency rallies as peripheral currencies weaken. Last time around it was the British pound. Its easy to see this now which tells us we are getting well into the flush out of the cycle:
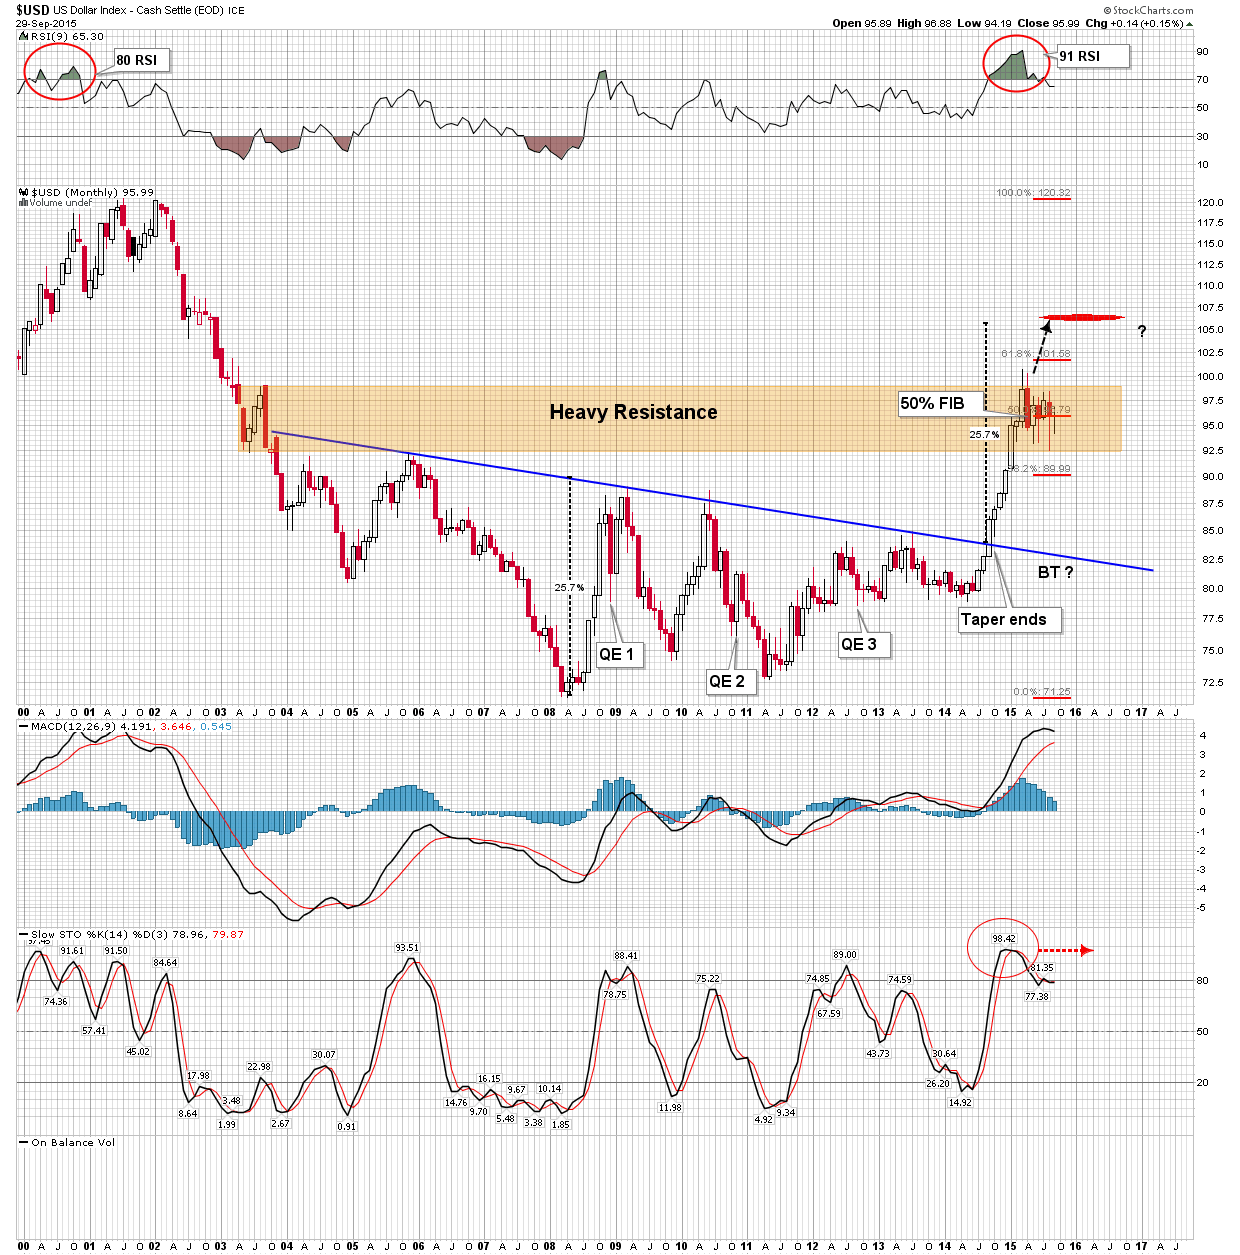
Pretty easy to see whats been going on here. The USD has just been eating its way through resistance onto a higher level. This is driving the world economic process and we see it in the next 3 charts:
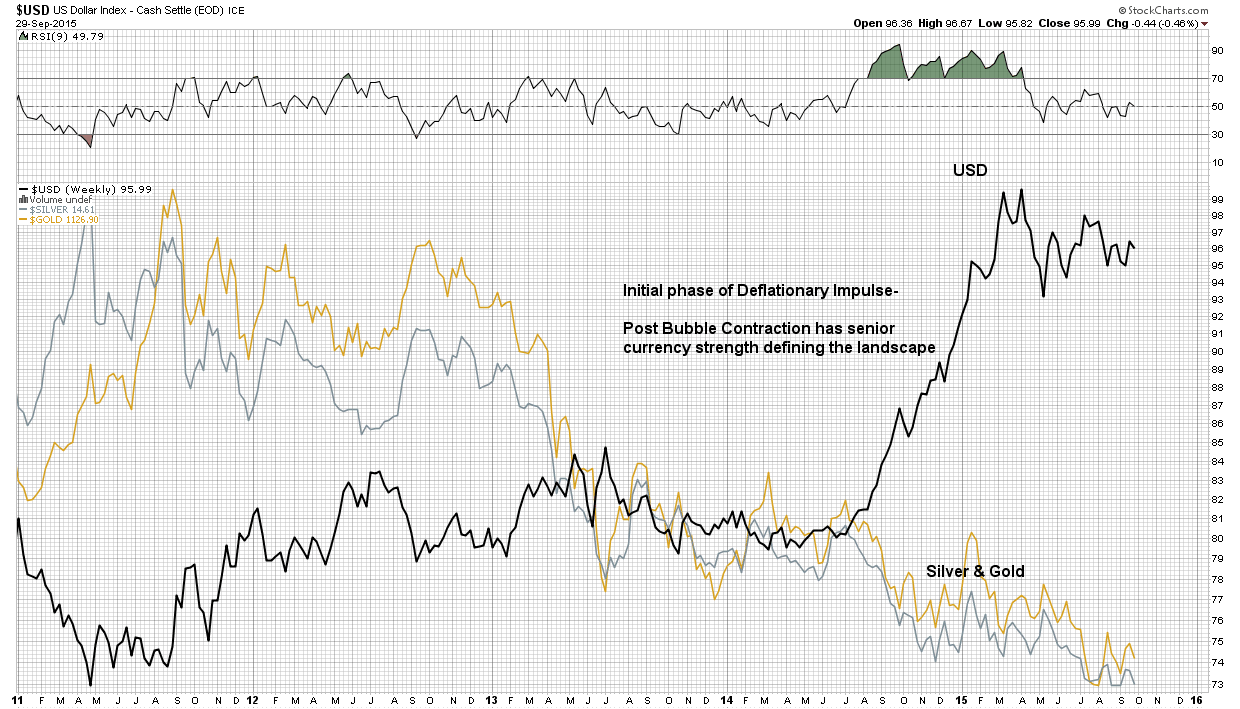
We can see the USD simply driving the metals into the dirt. The same can be said of the sell off in copper, a strong USD and reduced demand around the world for construction.

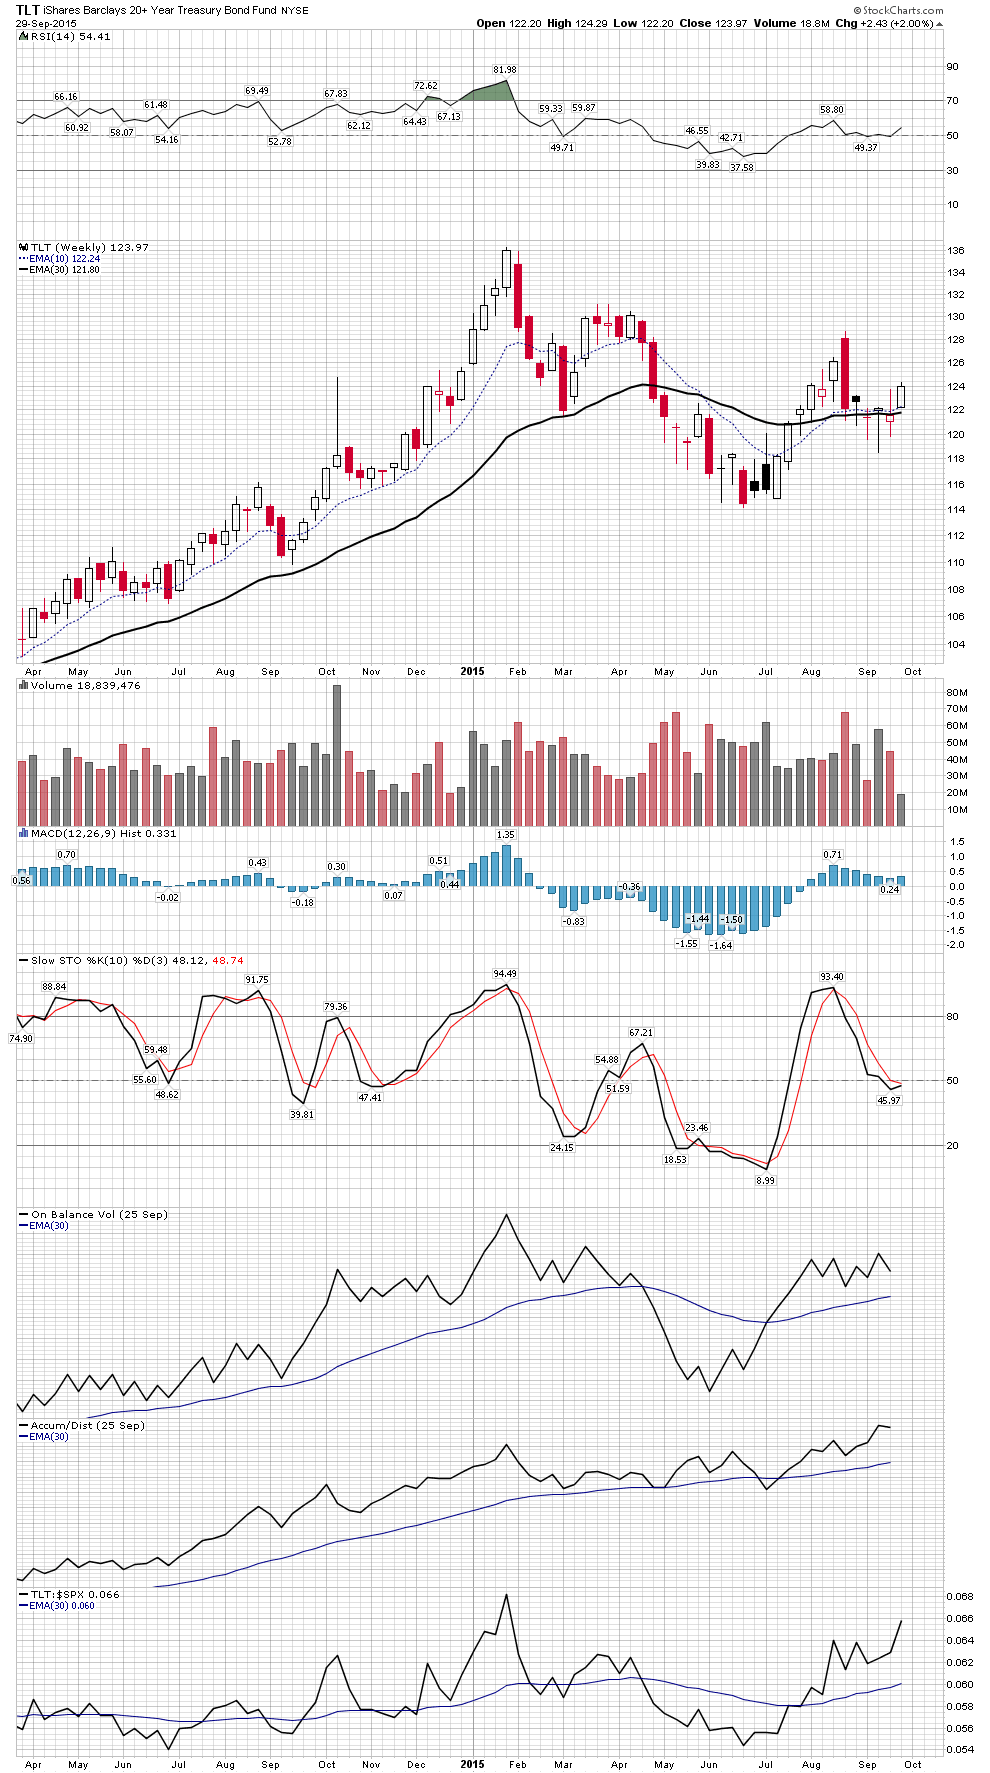
And we can see how this contraction is acting as a magnet for US Govt bonds. I find the majority of prognosticators are so bearish on bonds, but if one follows the past contractions in 1873 and 1930-31 it show that bonds will continue to gather strength. Check out the internals under the chart, all pointing towards further gains