Reply to US DOLLAR : TOO BIG TO FAIL
Chronic US dollar strength, deflation, shale oil and possible European disintegration
Shale oil and gas in the USA has been a very interesting development, following the bull market top in oil in 2008.
Peak Oil was the mantra at that time and was being heavily promoted in the media with various reports from the mainstream catching on to it just as the shale oil boom was about to reverse the 38-year decline in oil production in the USA.
I am fascinated by the confluence of events surrounding the period around 1971:
1967 Arab-Israeli war
Late 1960s London Gold Pool to hold gold at $35/ounce
1970 Peak Oil production in the USA’s lower 48 states (therefore excluding Alaska)
1971 President Nixon suspends gold redeemability of US dollar ending Bretton Woods era
1971 US dollar bear market starts accompanied by bear market in US Treasury debt
1973 Arab-Israeli war, Saudi oil embargo and oil crisis
1973-74 Spike in inflation and commodity prices including silver and gold and crude oil
1979 Iranian revolution and apparent resurgence of Muslim power
1979-80 Second spike in inflation and commodity prices including silver, gold and $40 peak in crude oil
1980 US dollar bear market ends as dollar comes close to losing reserve currency status
1980-82 15% interest rates bring capital back into the US dollar
1982 US Treasury bull market starts and lasts for 30+ years
1990-91 Iraq’s invasion of Kuwait
1991 First Iraq War – Operation Desert Storm – oil spiked to $40 again
I postulate that a key event was Peak Oil production in the USA. This could have been a main driver for all the surrounding events, with the USA becoming a chronic oil importer, weakening geopolitically and economically and suffering from inflation for a decade afterwards.
I also think that the peak of oil production in the USA lower 48 states was a superb time for the US to go off the last vestige of the Gold Standard i.e. the Bretton Woods system, since otherwise its gold reserves would have soon been emptied out paying for oil imports.
Now let’s compare to the present day. We have rapidly increasing US oil production of oil and natural gas from 2010 to 2014, reversing half of the previous 40-year decline, a halving of US oil imports from the rest of the world and a 50% crash in the oil price in 2014, record low US interest rates, a continuing US Treasury debt bull market, etc.
I am beginning to wonder if this reversal in Peak Oil continues in the USA, will the US dollar index reverse its 40 years of declines too?
We have two factors that could create a larger degree bull market in the US dollar than the three rallies that we have seen since 1971. Both of these factors have been operating recently:
One is the possible reversal of Peak Oil in the USA and a sustained increase in oil production, surely a major geopolitical plus for the USA.
Second is the credit crisis, where as Bob Hoye loves to point out in his interviews on Howestreet.com, and elsewhere, the senior currency is usually chronically strong for most of the time of a credit contraction as debtors and speculators and move to raise US dollar cash to pay off debts and margin calls. This would be comparable to the 1930s, a once in 80 years type event, so why would we assume that the movements in the dollar would simply follow the downtrend of merely the past 40 years?
Both are deflationary in their implications and tend to strengthen the US dollar, which is the reserve currency.
There is also a third factor. The Euro currency peaked in 2008 at around $1.60 and subsequent to that, there have been increasing signs of the disintegration of the Eurozone and the European idea. If we have reached peak European integration, then there is a possibility that the 45 year bear market in ehe US dollar that coincided with the formation and integration of Europe from the early 1970s until 2008 could reverse and go into a generational uptrend.
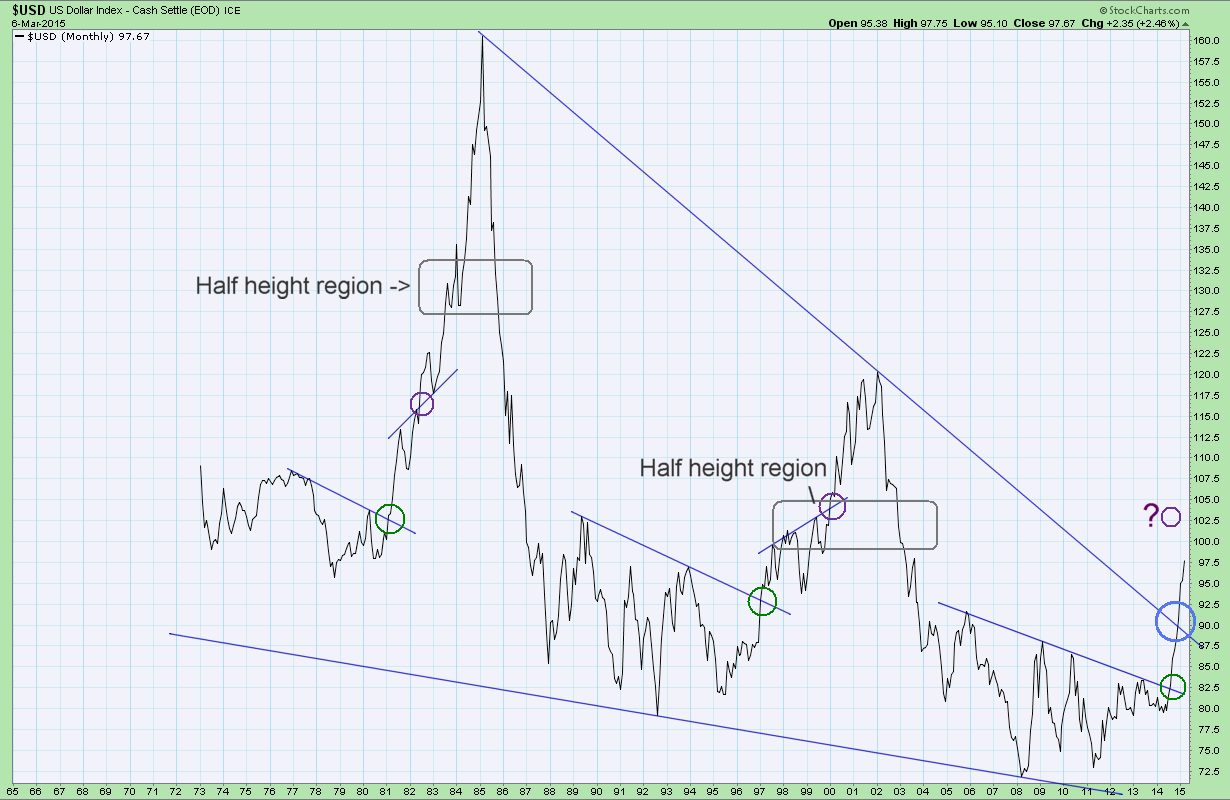
Looking at the chart of the USDX since 1980 from www.stockcharts.com, we can also see that there is a potential bullish falling wedge pattern in the dollar and the measured move from such a pattern usually undoes the entire wedge – this could take the USDX back to its starting point of 160.
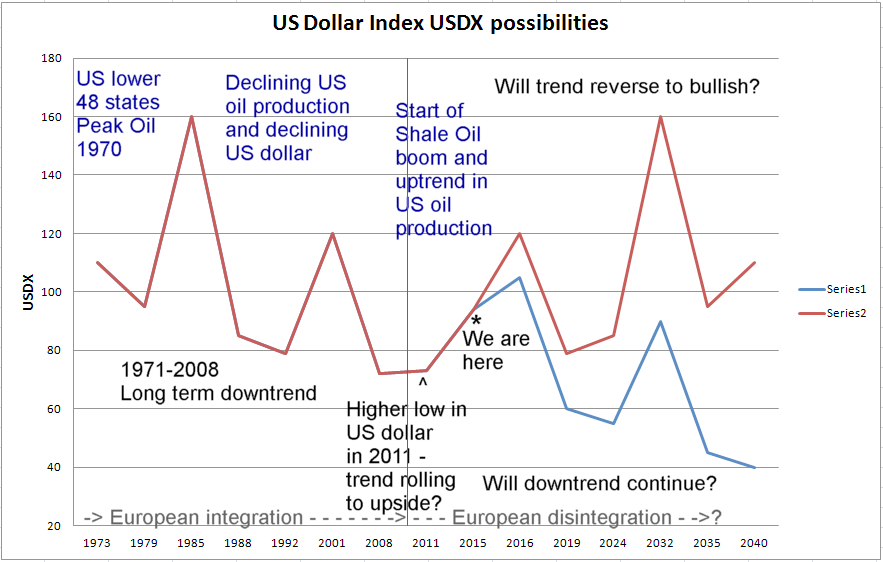
Here is another potentially bullish scenario for the US dollar compared to the continuation of the previous long term gentle downtrend:
Now of course, this is quite an extreme possibility and would likely necessitate the US becoming a net energy exporter again with an uninterrupted increase in oil production to new high to exceed the 1970 peak of over 10 million barrels of crude oil per day.
Such a situation could mean that the top in the gold price in 2011 might be a very long term secular top. Perhaps gold might not resume its bull market until shale oil has peaked, whenever that happens. Some forecasts from the EIA indicate that might not happen until 2018-2020 at the earliest. Shale gas production is forecast to peak even later.
http://www.eia.gov/forecasts/aeo/tight_oil.cfm
However, the new shale oil production is more expensive to bring to market than conventional oil. The recent crash in oil prices due to this increased production and to demand destruction in the light of the economic slowdown in various parts of the world might halt shale oil development and cause a credit crisis centred on this new oil industry. The success of shale in boosting oil production so quickly could be its downfall, at least temporarily. Perhaps there will be a year 2000 technology bubble style crash. However, the tech boom did not stop, nor should we expect progress in shale oil to stop altogether, even if the bubble bursts, making for quite a complicated situation.
This is a fascinating dynamic and the whole shale oil boom phenomenon seems to put a dampener on the prospects for a spectacular gold bull market going forward in my view.
Here is another piece of evidence to back up this hypothesis. US oil production had basically a 40 year decline from 1970 until around 2010. During this decline there was a reversal and increase in oil production between around 1980 and 1985 and a big drop in US oil imports. See this file:
http://commons.wikimedia.org/wiki/File:US_Crude_Oil_Production_and_Imports.png
The increase in US oil production and drop in imports in the early 1980s werecoincident with the exceptional strength of the US dollar index, which spiked up to 160 in 1985. The subsequent dollar crash from 1985 to 1987 is usually attributed to the Plaza Accord but it is also coincident with the downtrend of US oil production resuming and a renewed increase in oil imports.
The present time is perhaps comparable to the 1980 to 1985 period where there is a significant increase in US oil production and now we have the renewed US dollar bull market. It would be typical for the US dollar bull market to last 7.5 years on average, perhaps up to 9 years since the low (in March 2008) but might it instead last until shale oil production in the US reached its peak?