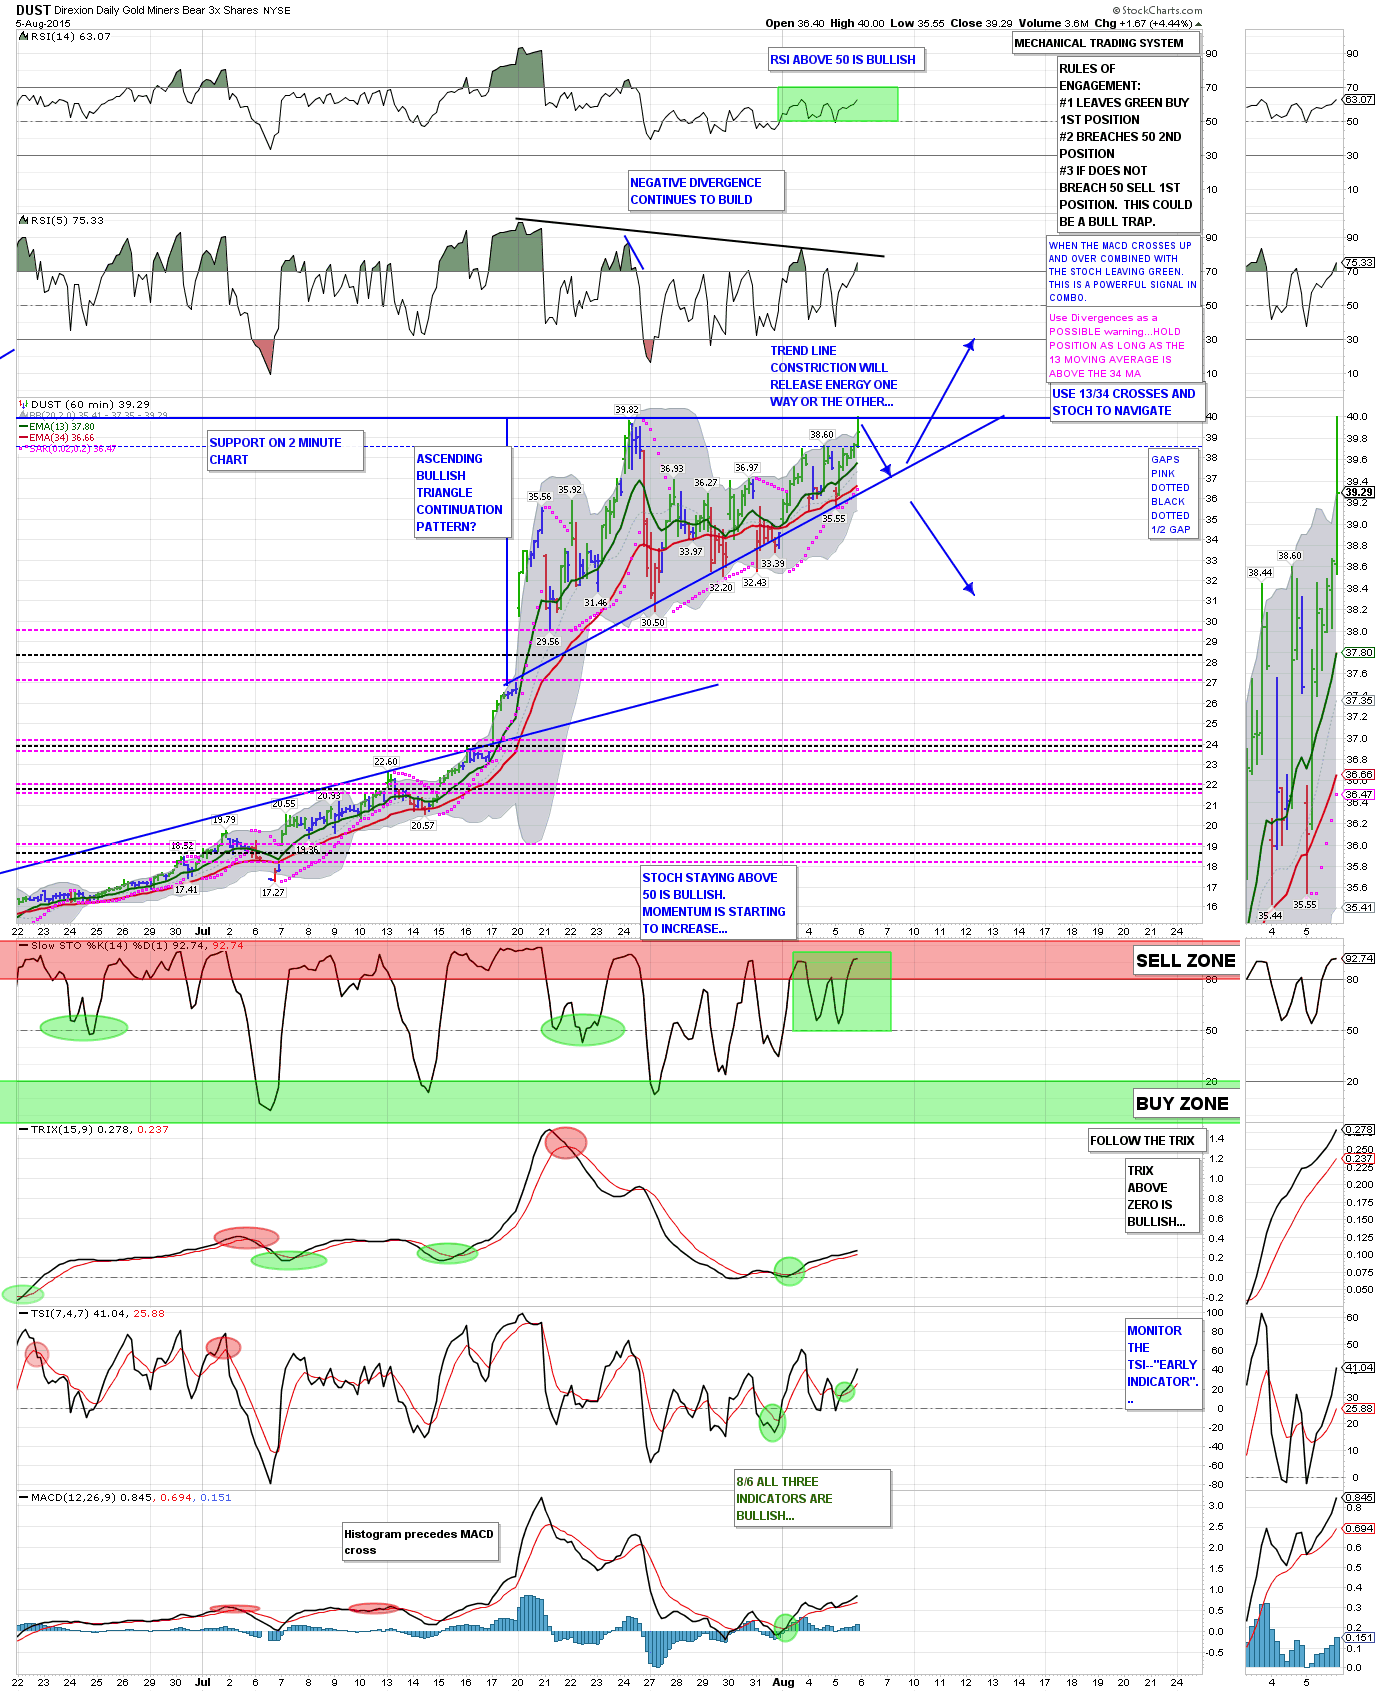
Potential Ascending Continuation BULLISH Triangle on DUST 60….

Iniitially thought DUST 60 was in a bear flag; however, this could be in play. Stockcharts is down as I type, will adjust chart when able. Just be careful if long. Till now, I was expecting a pullback to fill the gap and/or touch the 34 MA as the last run up on DUST daily. This could be the route. FGC’s JDST 2 hour chart gave me this thought.
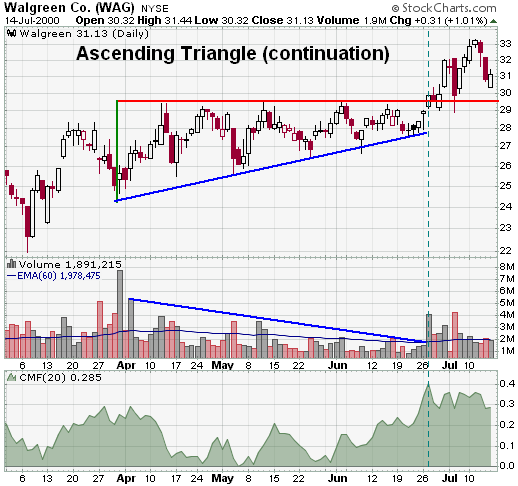
Ascending Triangle (Continuation) The ascending triangle is a bullish formation that usually forms during an uptrend as a continuation pattern. There are instances when ascending triangles form as reversal patterns at the end of a downtrend, but they are typically continuation patterns. Regardless of where they form, ascending triangles are bullish patterns that indicate accumulation.
http://stockcharts.com/h-sc/ui?s=DUST&p=60&yr=0&mn=1&dy=15&id=p20910604389&listNum=1&a=388664339
DUST premarket is 38.75 at 8:35am. I think the pre and post market has pretty low volume but I find it’s at least a slight indication of the market. It just jumped to 39.34. And gold is doing something weird. $1 swings on the 5 min up and down, but in a slightly downward trend.
http://charts.dacharts.net/2015-08-06/d1485.png
another chart form october.. see how it broke the low and then recaptured it.. and then down.. i really dont have a clue if it goes that way again.. something to keep eye on .. for it to break to the upside, it would really need to break the top descending triangle rail for longs; but the october and now similarities are hard to shake form my mind
Thanks SS