One Last Chart – GDX Weekly
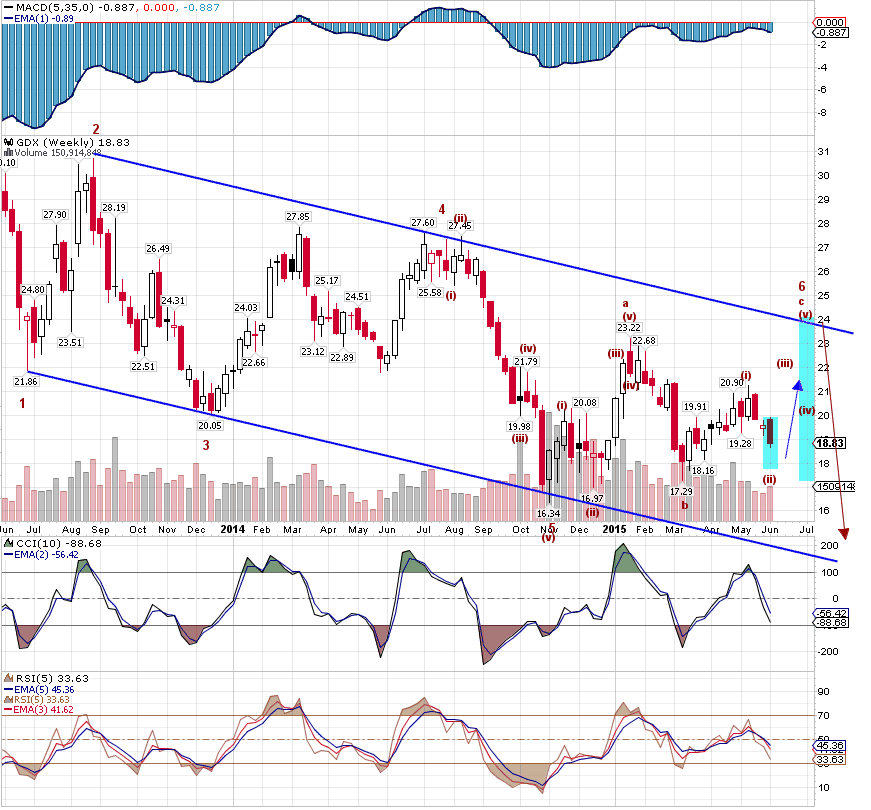
The GDX Weekly Chart has been holding pretty good to this down channel. Starting from Pt 4 of the channel we went down in 5 waves to Pt 5 of the channel. From Pt 5 we should be seeing an ‘abc’ up corrective. We are working on the ‘c’ wave up now. ‘a’ finished in 5 waves at 23.22 and ‘b’ finished in an abc to 17.29. Minor (i) of c completed with 5 waves, Minor (ii) of c in-work now. Minor (iii) of c should be longer than Minor (i). Per EW Rules (iii) could go as high as 26.88 (161.8%). However, since the 100% measured move of the abc corrective aligns with the top of our channel, I just guessed a placement for (iii) slightly above Minor (i). Minor (iv) should not retrace much more than 38% and then onward to Minor (v) or c. This should be a good count for GDX especially if the market makes a significant move higher. Note also that my CCI and RSI indicators are approaching a bottom possibly this week. Depending on when we get our trigger line crosses could validate or invalidate this count…. I actually like this count because the 100% measured move of the corrective aligns nicely with the top our channel and it would hurt a lot of Bears. The Minor(ii) we’re working on now aligns with the GDX 2HR Chart presented earlier with a target of 17.51 (our 100% measured move target for Minor (ii) on this chart would be around 17.68). Gee did I just turn Bullish!!!!! Well on the GDX 2HR Chart presented earlier after the abc corrective completes we do expect a 5-wave move up!!! And if you look at the EWO on the 2HR Chart, it’s telling us to expect one more low after the wave (iv) up completes. BTW this looks like a Bullish Wolf Wave forming on the 2HR Chart….. This also plays well with the 2013 GLD Chart – one more up into middle of June then down for first of July lows…. hmmmm…..