IWM Short
Yesterday I entered into a short position with IWM (using TZA). So far so good…, here is what I am seeing. First off IWM consists of mid tier domestic stocks. That’s right not the multi international conglomerates who are buying back their stock with free FED money not available to you nor I. It has been the weakest sector for the past year. When one understands that large cap stocks have been advancing not on the strength of the economy but on the increasing recklessness of FED interventionist policies one can see why these domestic mid tiers are lagging the other indexes. This index actually is more correlated with actual corporate performance. So sure QE and ZIRP have provided support to this index, but not as directly as the other indexes. So the theory is these stocks will falter first, which appears to be happening.
Duration of bull market EW count- I have never been able to effectively trade with EW, however it has provided nice clean obvious counts of a bull market once it is over. I have to say this is what they do look like after they have exhausted themselves. Maybe this is it and it has a nice broad H&S top spanning 6 months. Note the collapsed volume in the second half of the H&S. I ask what’s going to hold this thing up without volume. Remember that old stock market adage: Stocks fall of their own weight.

Weekly Line chart H&S- with Volume analysis- Here is some interesting volume characteristics that is showing up on the weekly charts. It appears to me that volume has undergone a character change. Note when the trend was ascending the volume was too. Up moves were powered by an increase in volume. That’s how it is supposed to work. However in the last run up to the peak the volume started to trail off. Once the peak was in volume started to increase on the way down, then in the last snap back which put in the RS, volume simply evaporated. If we violate the neckline we could expect a measured move down to 103. However further volume analysis calls for a fall to 92. That’s about a 15% correction

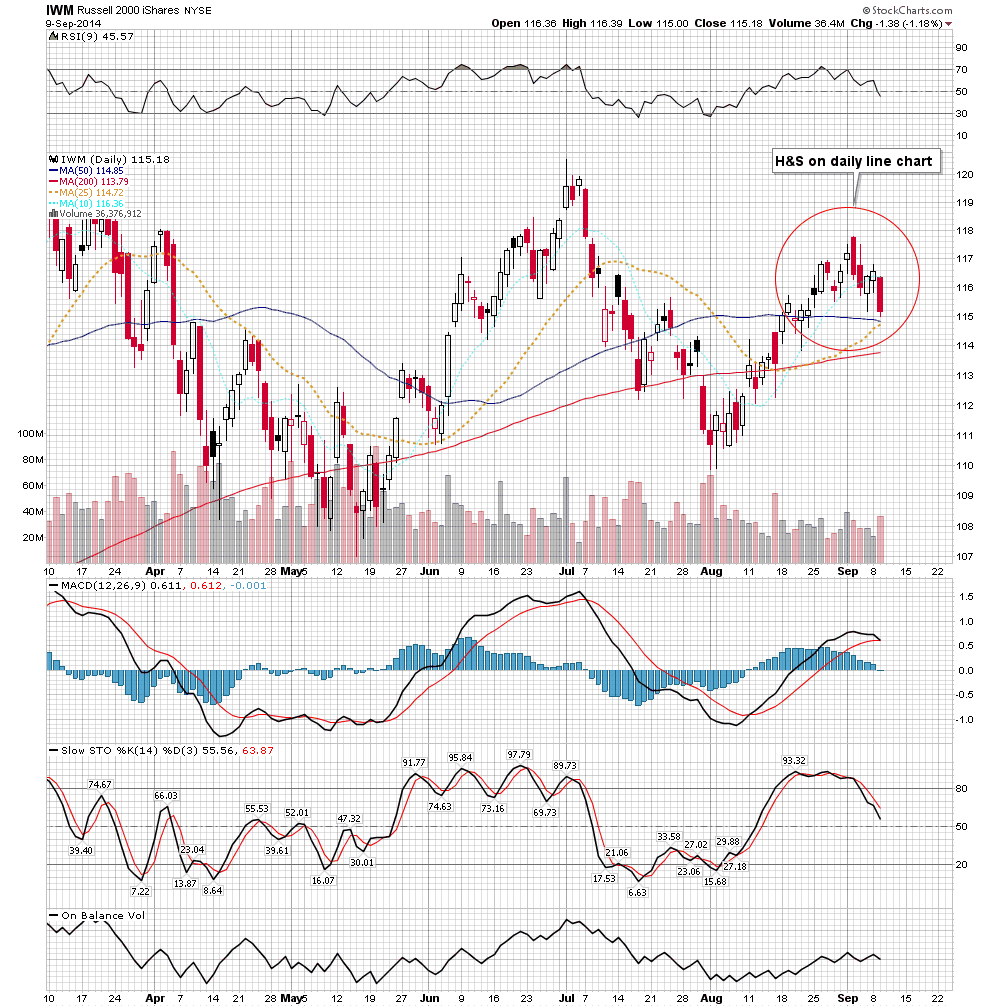
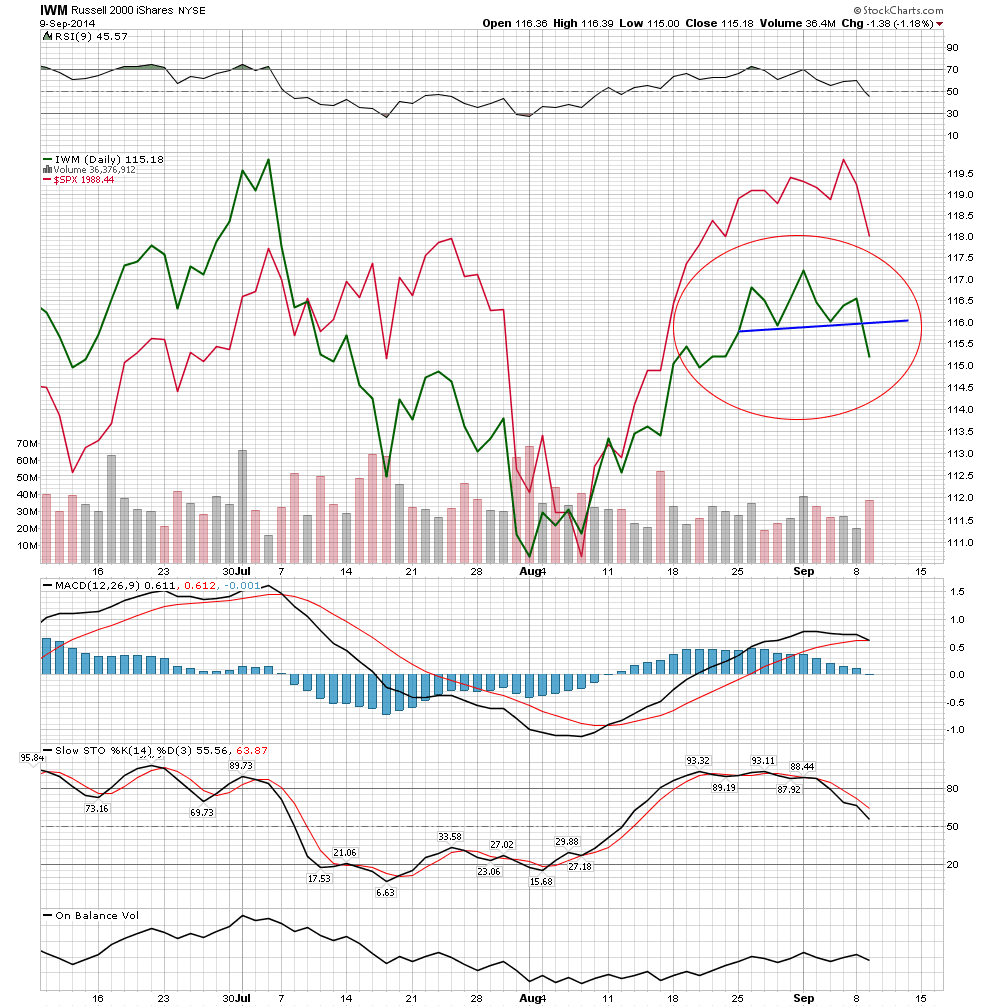
Plunger’s standard daily chart- My standard daily chart shows a short duration H&S now touching the 50 DMA. This H&S is a fractal of the larger 6 month H&S. It is quite easy to see in my SPX comparison line chart to the right. Note the daily stochastics have now rolled over and recall the weeklies are just now ready to crossover and establish a down trend. Overall this is an early phase short as it is certainly not advanced. In the past these set-ups have been aborted and haven’t worked out. We will see if this one finally does
Thanks Plunger! Great analysis. Makes my want to tread lightly.
And thanks for the great call yesterday. Dipped my toe in the PM long pond today and got the hell right back out even.