Buy, Hold, Add On Weakness
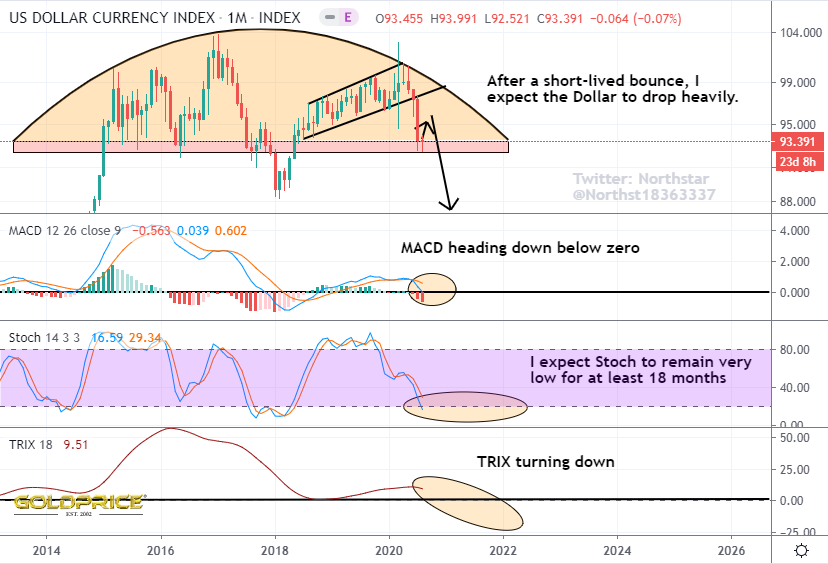
Weakness is dead ahead
Weakness is dead ahead
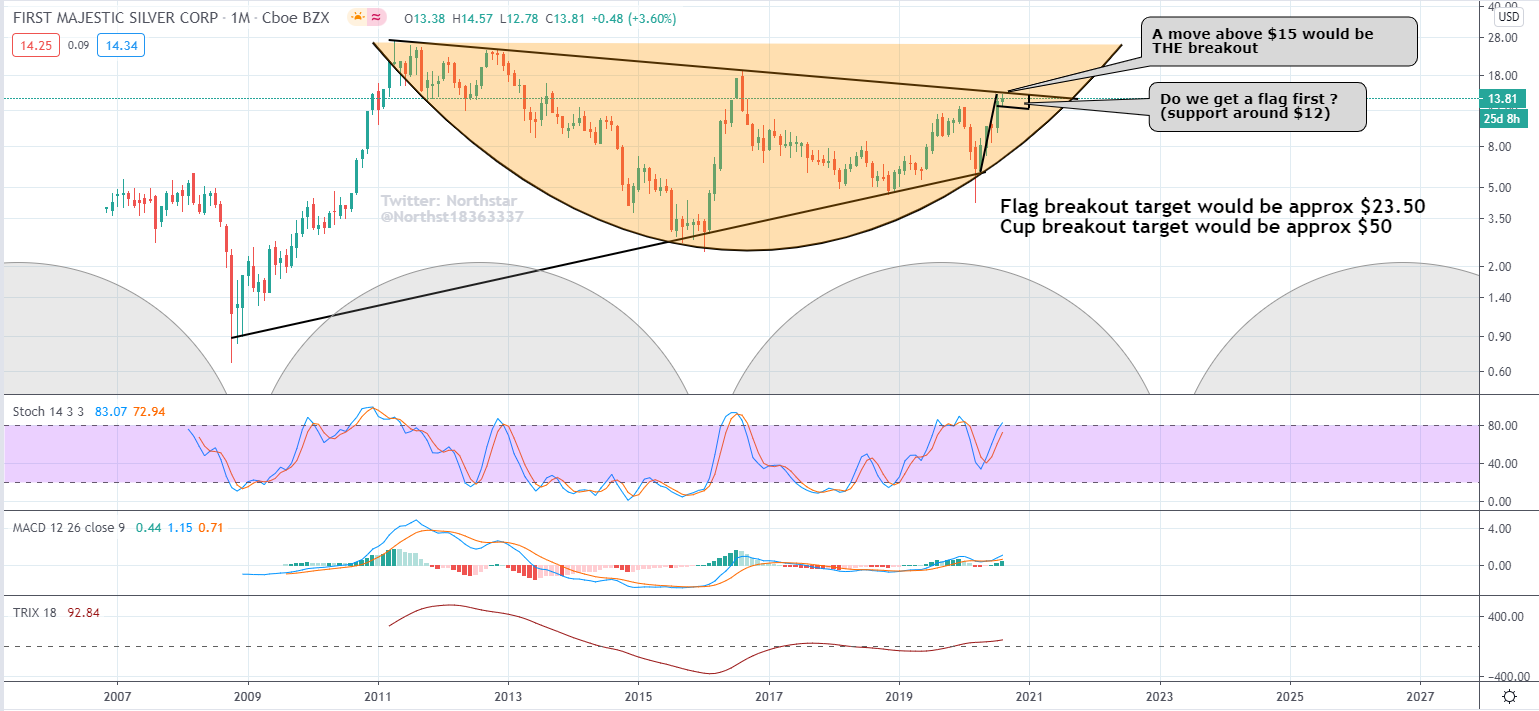
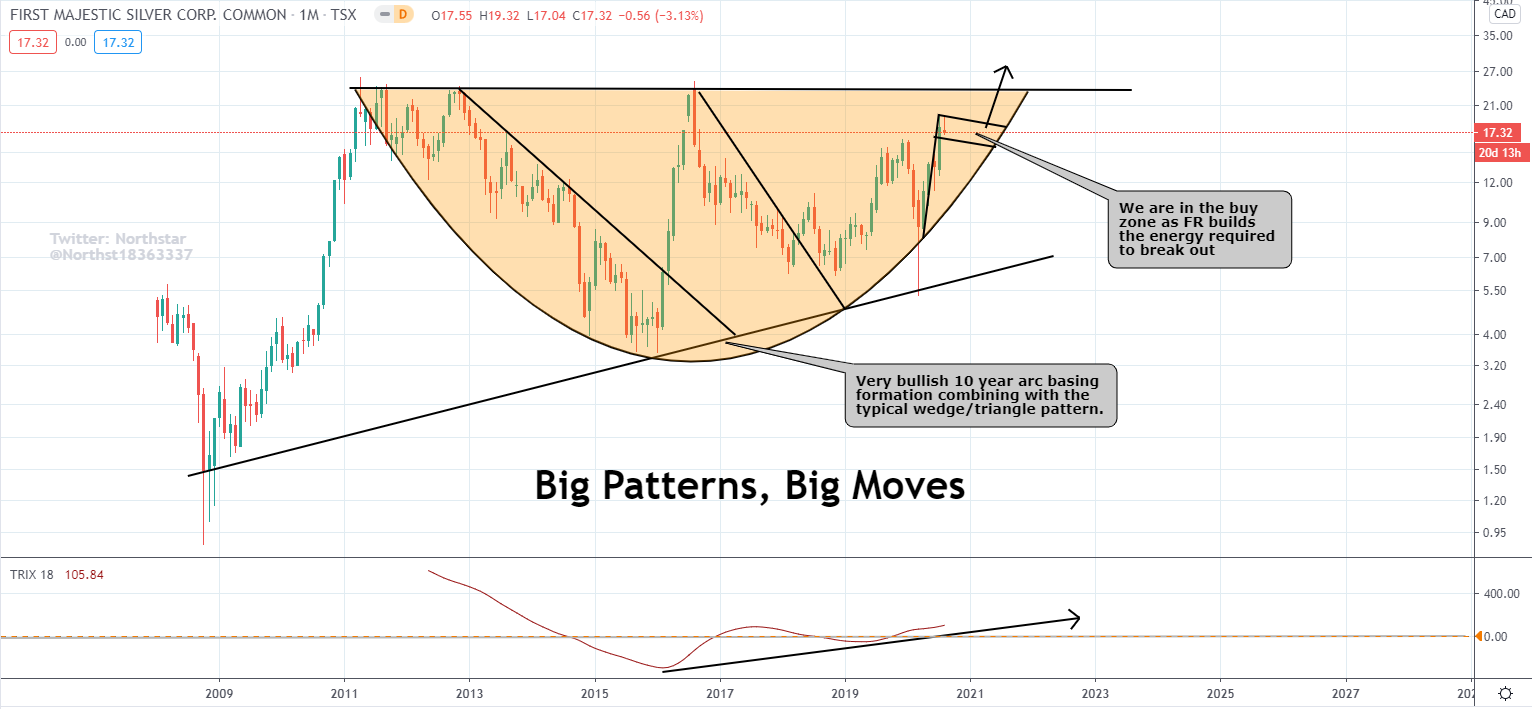
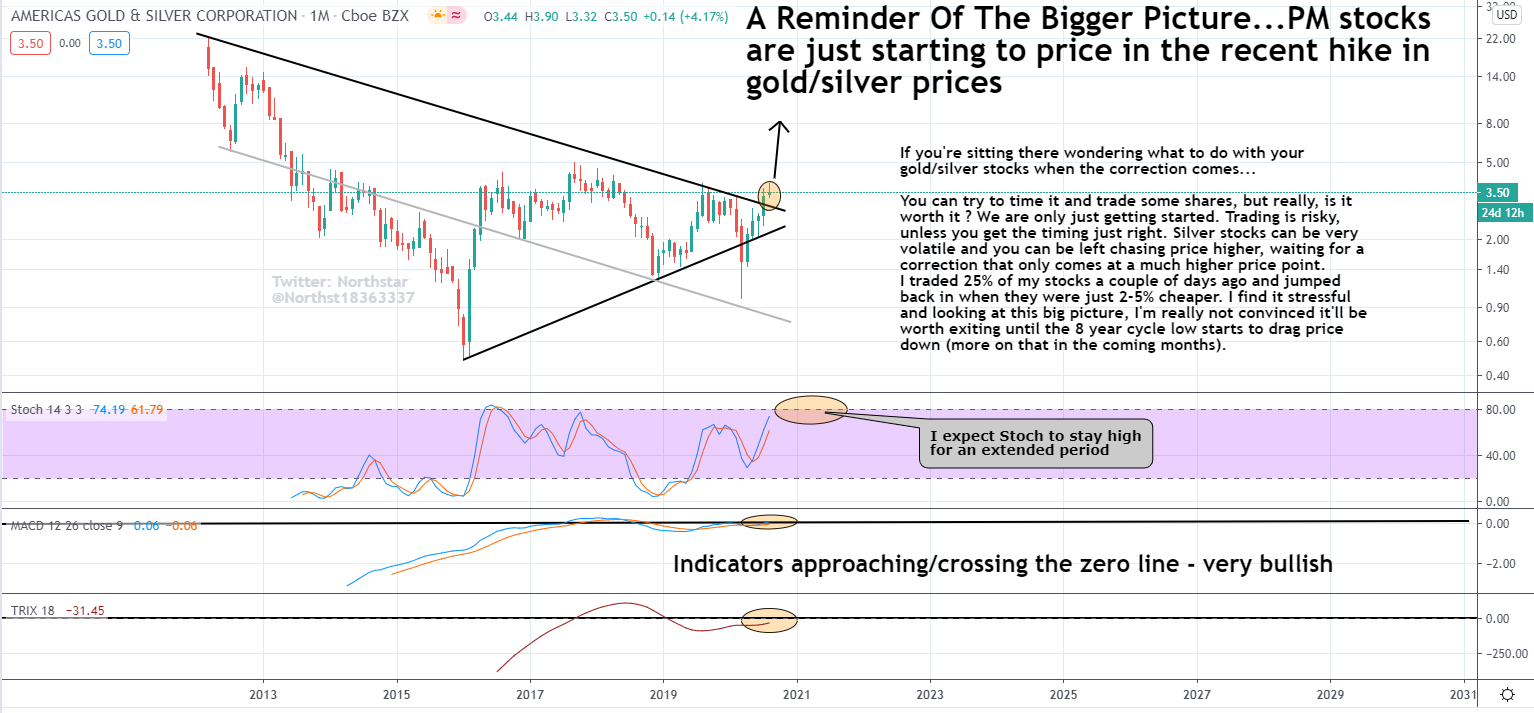
For anyone who believes in cycles and bought near the 2015/2016 16-year cycle low, you will have multiplied your investment by a factor of 4 already (and we haven’t even broken out yet). That’s despite a drop from over $23 to under $6 along the way !! Balls of steel required. Buy, hold, add on weakness, then hold your nerve during any huge drops. Easy to say. Tough to do. As always , do your own due diligence 🙂
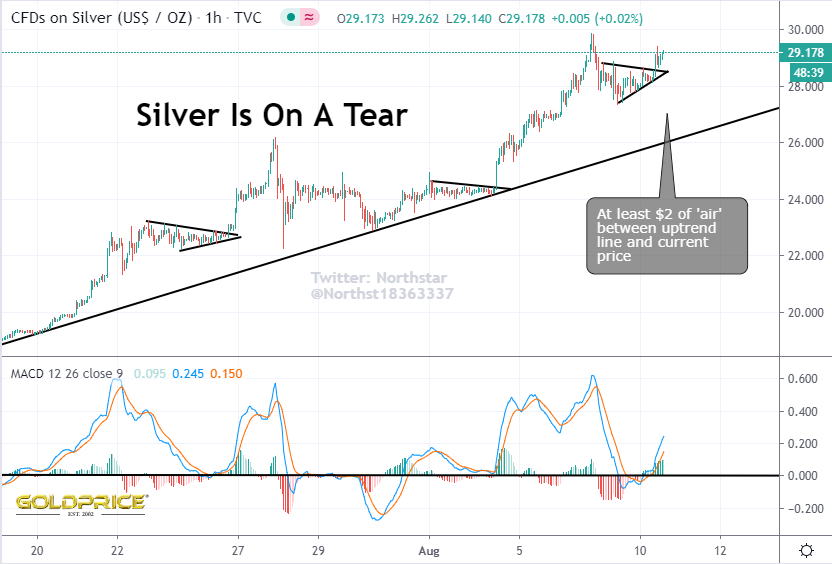
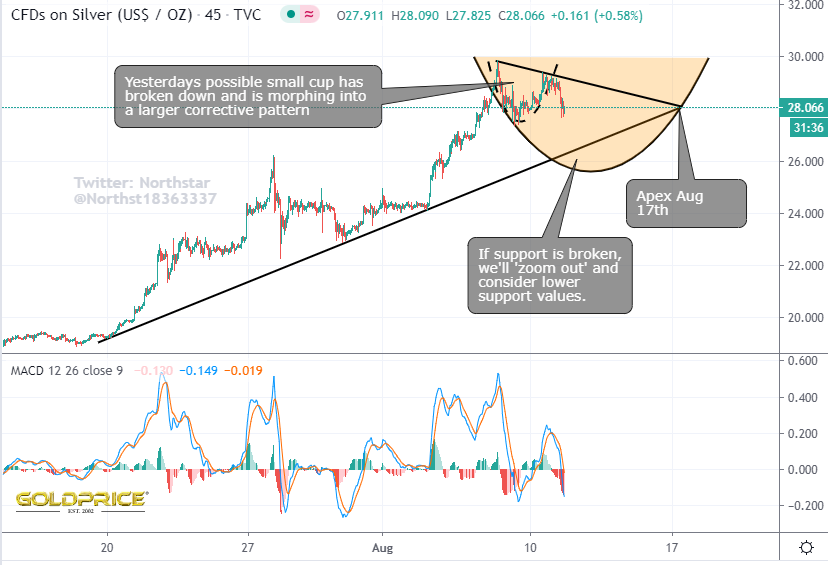
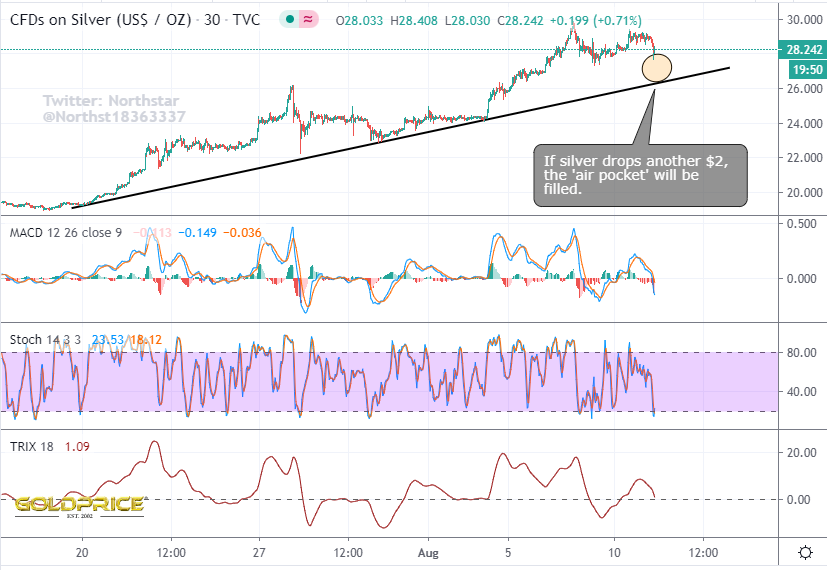
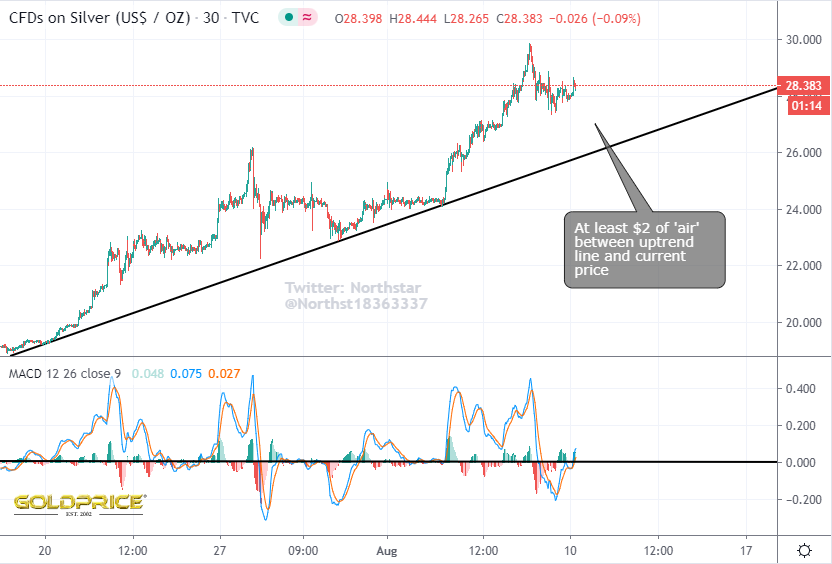
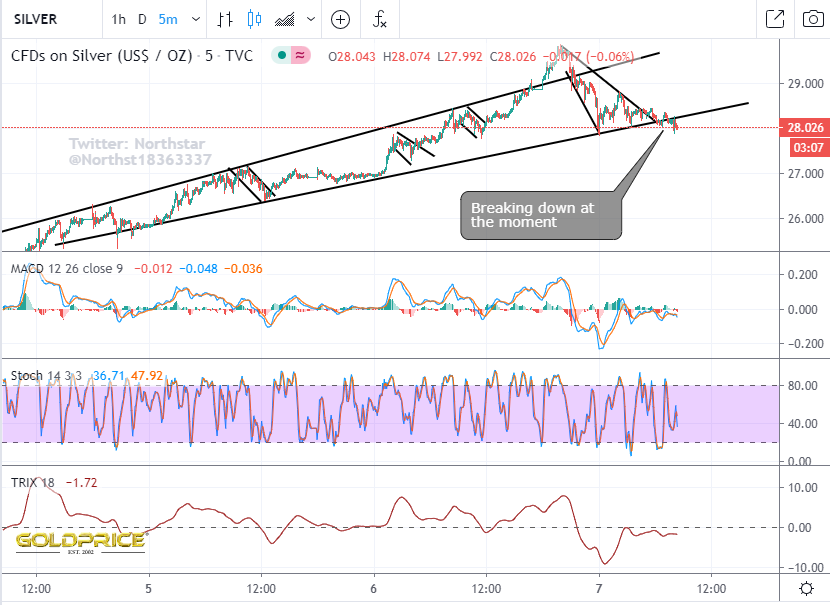
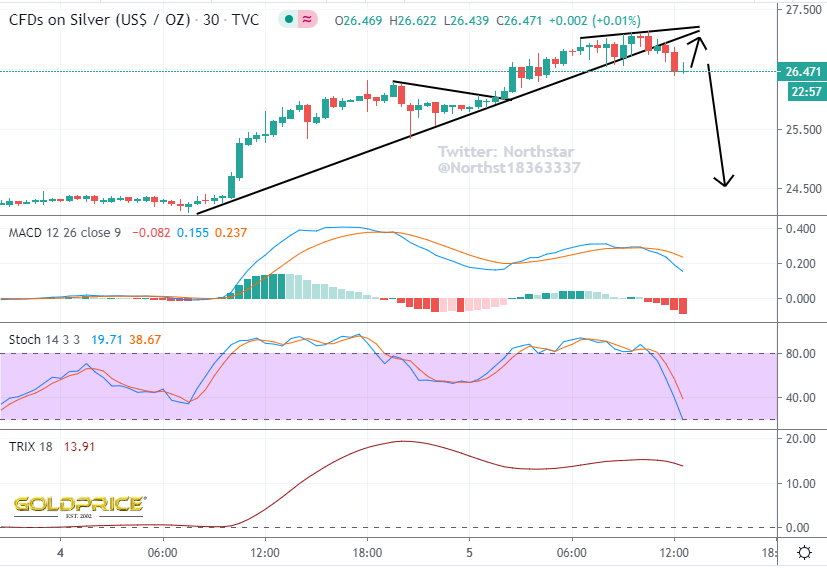
A short, cyclical decline is taking place. Silver has found the ‘air pocket’ I mentioned yesterday. Will the $26 region hold ? I think, on balance, probably not.
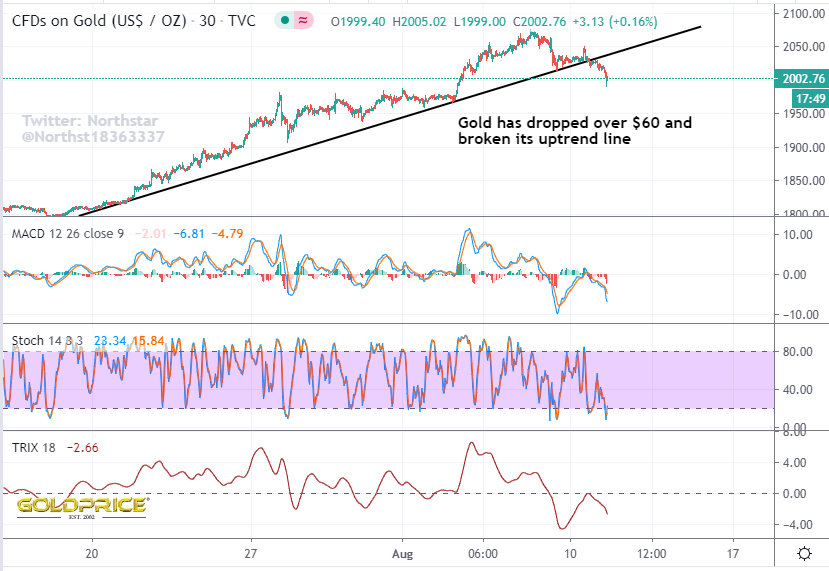
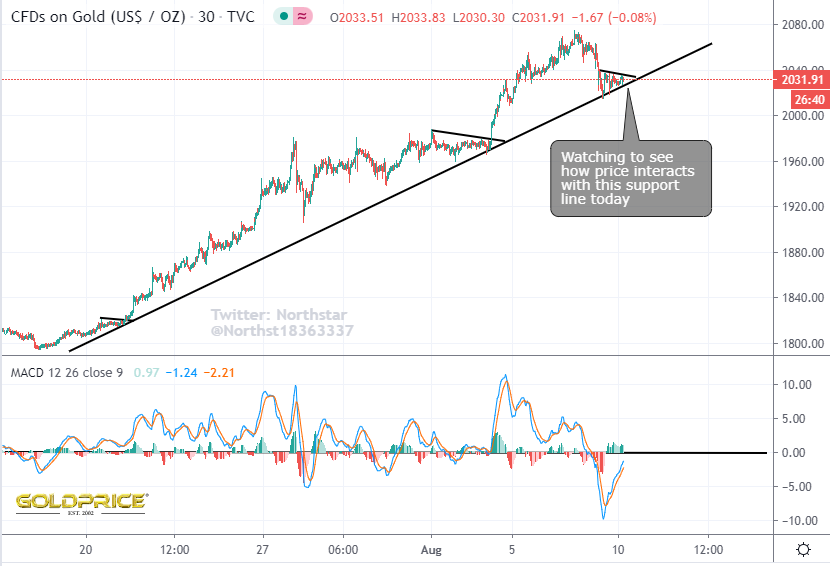
Price is going to interact with the uptrend line since we broke above the $1800 area today. What happens will tell us if we can expect a much larger correction.
Edit: Silver added
Pullbacks on the way. An 8 year cycle low to navigate, then even higher.
‘2030 agenda’…’great reset’…I’m not a conspiracy theorist – you don’t need to be anymore, not if it’s coming straight from the World Economic Forum. The gold charts point to a top as we approach 2030. Another piece of the puzzle right here…
https://twitter.com/Northst18363337/status/1292407827563270144
Watch the whole clip
start at 6 minuets
https://www.youtube.com/watch?v=pfVdMWzKwjc&feature=youtu.be
Bounce and down hard. It’s do(o)med 😉
In a bull market, price action extends to the right (in terms of cycle low to cycle top) allowing more time for price to rise. So-called ‘right-translated’ cycles leave shorter periods of time for price to pullback before the next ascent begins. I’ve tried to show that in the following chart…
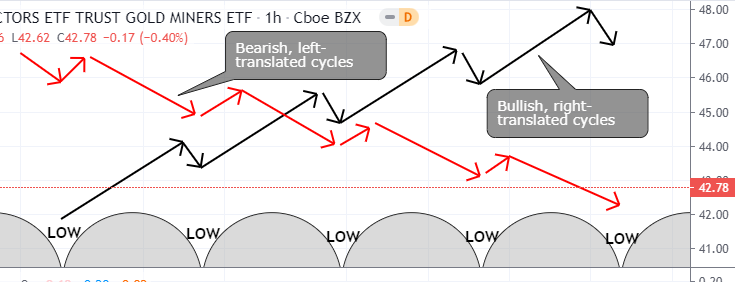
Apart from the upcoming 8 year cycle low, this process of higher highs and higher lows should continue for many years to come. Look back at the 2008 cyclical low for an idea of what I mean.
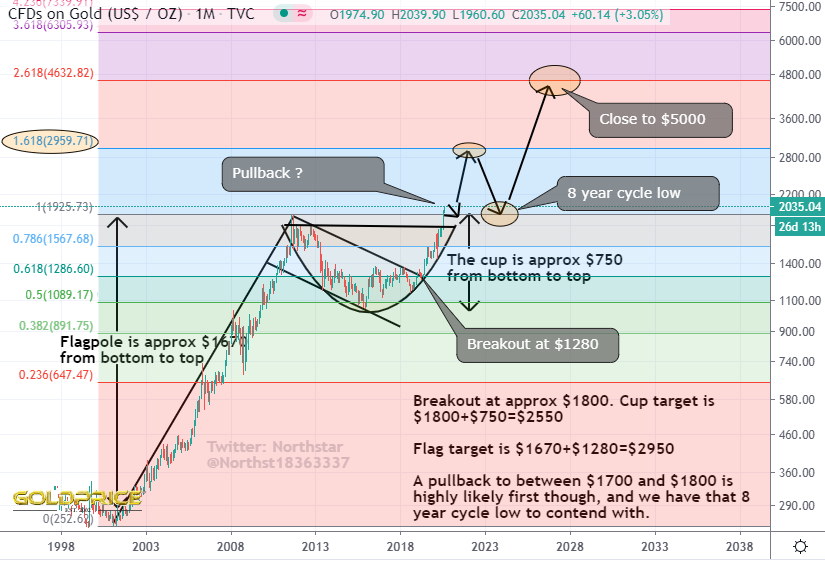
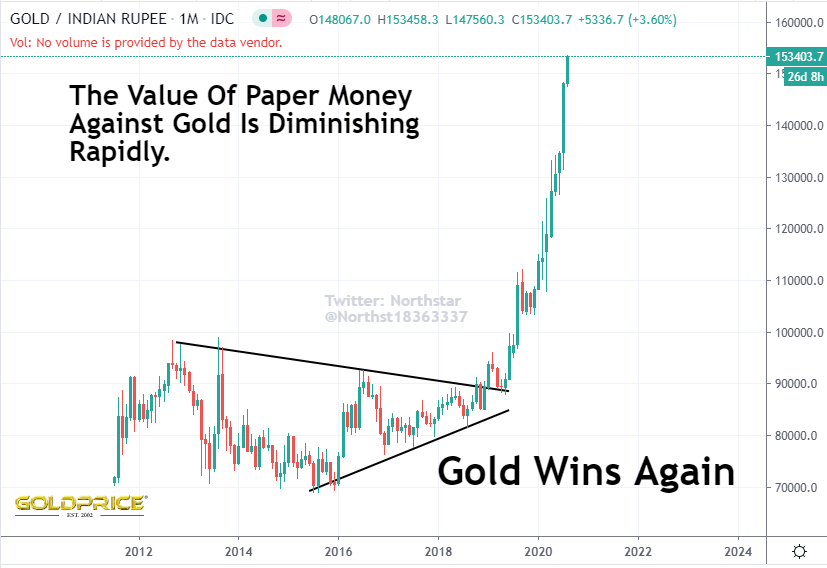
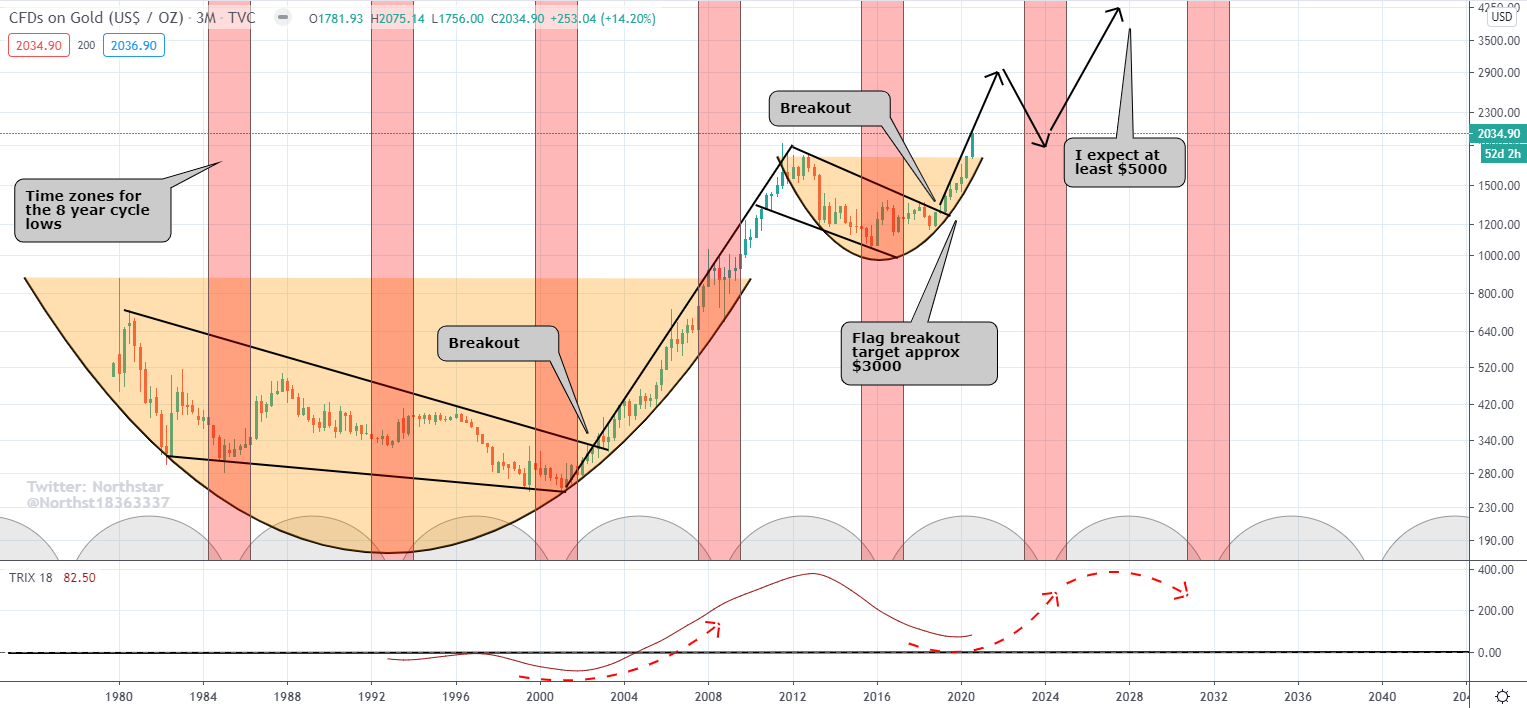
It’s so important to keep your eyes on the prize, and not get completely shaken out of your positions during a PM bull market. With that in mind, let’s take a look at where we currently stand in the grand scheme of things with gold…
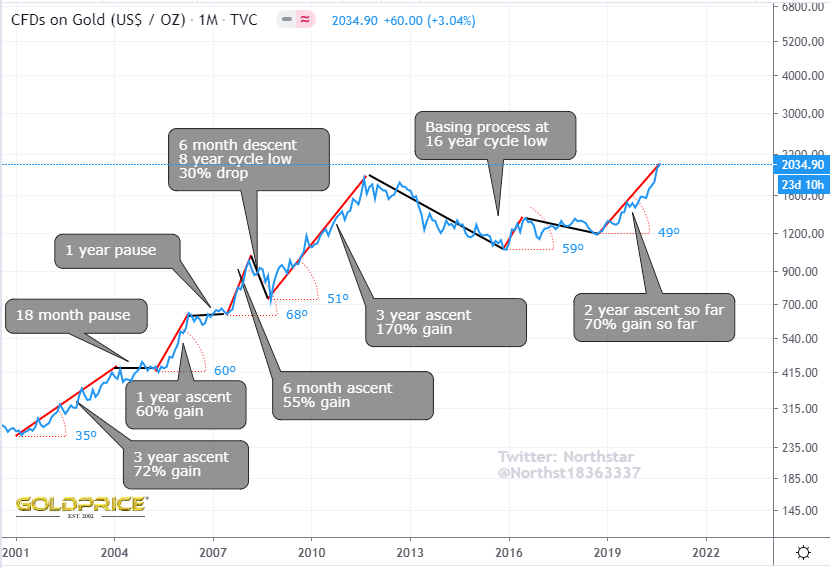
What we can conclude from this is that the current move is pretty normal, but that a fairly shallow (in terms of the big picture) pullback/consolidation is likely to come, and may well last a year or so (perhaps a few months trending down, then a few months trending back up, before breaking out again). OK, great, so what about Silver, which has been explosive lately…
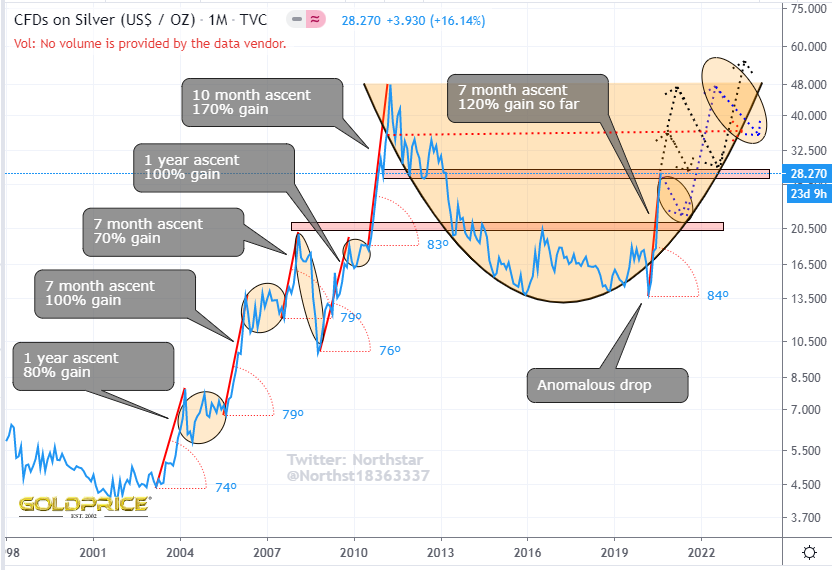
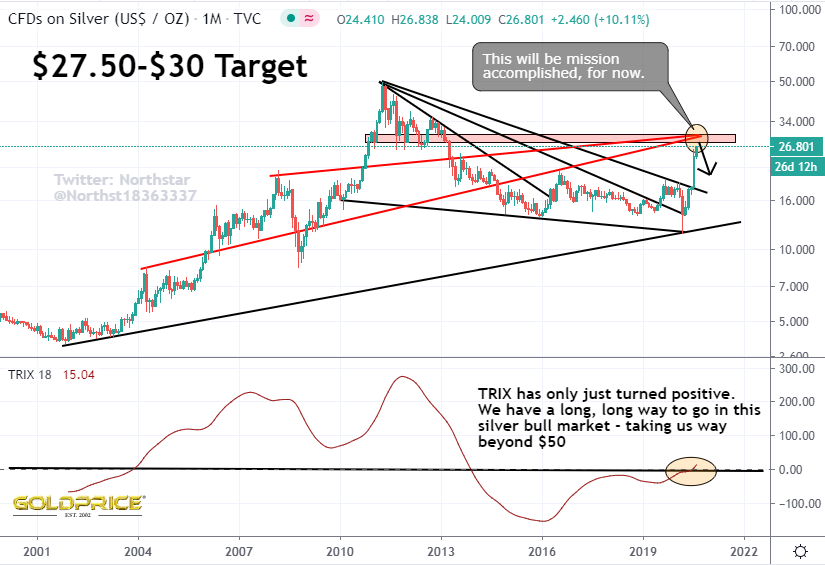
The numbers and percentages quoted are approximate, and just calculated roughly using the line chart. We can see that the angle of ascent has been very steep, but in terms of time we may have a little further to go. I see a number of scenarios, all of which resolve bullishly. We can either progress to around $35 then pullback before the move to $50, or we pullback here and then make that move. I do expect a sizeable correction into the 8 year low though, and a drop from $50 to either $35 or $28 would fit the bill. After that it’s on towards some number I haven’t yet started to work out properly.
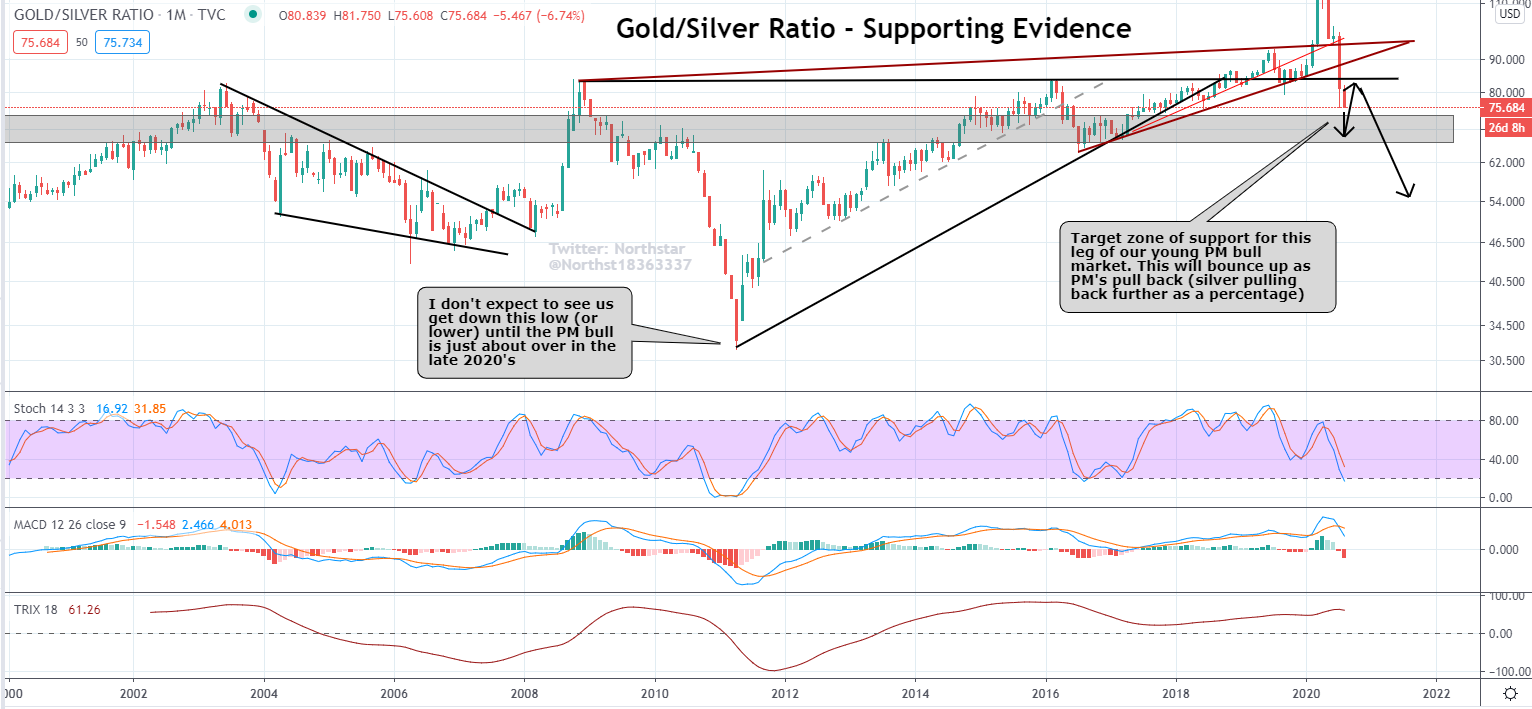
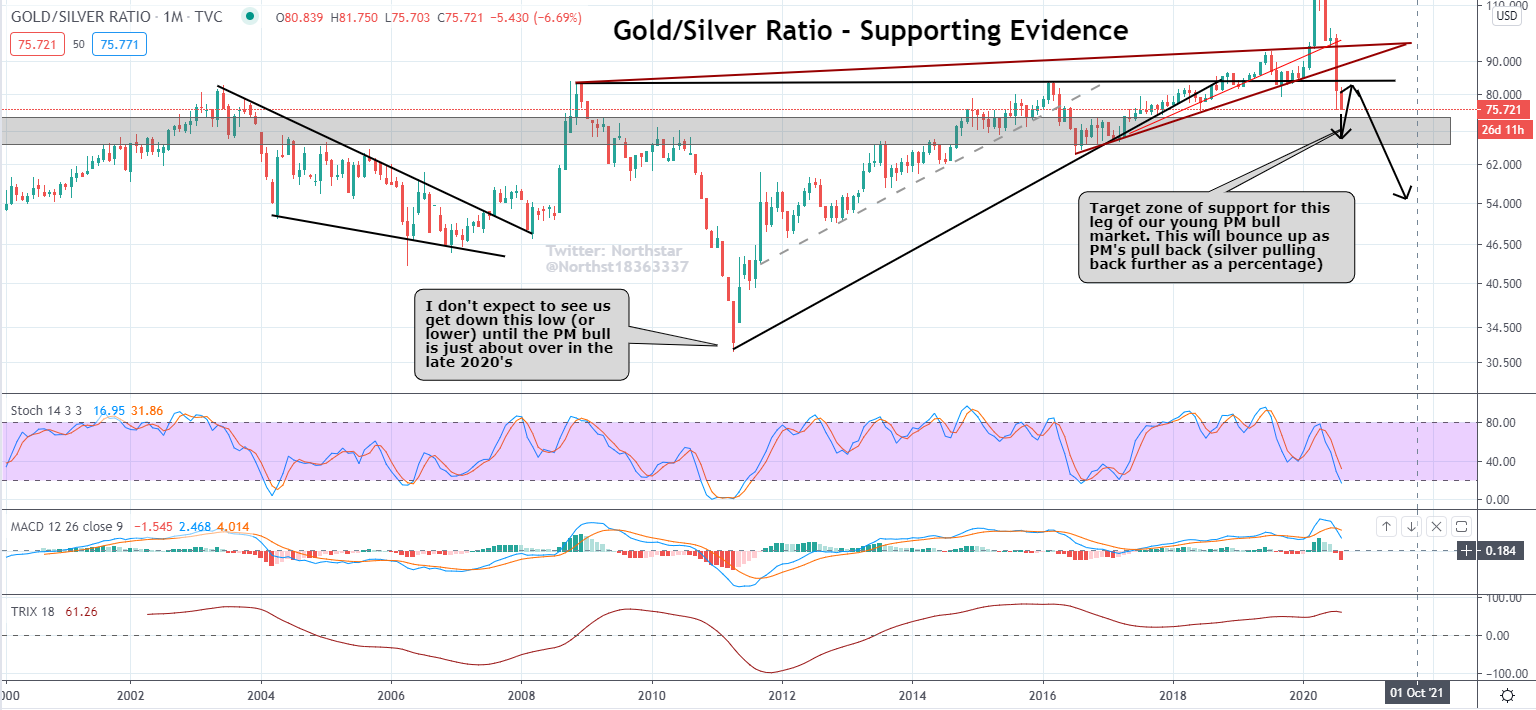
SIL & SILJ will clearly catapult upwards as all of this unfolds, but their charts don’t go back far enough. I’ve taken a close look at HUI though, and you can expect larger percentage gains for the silver miners as the gold/silver ratio continues to unwind. Here’s the chart…
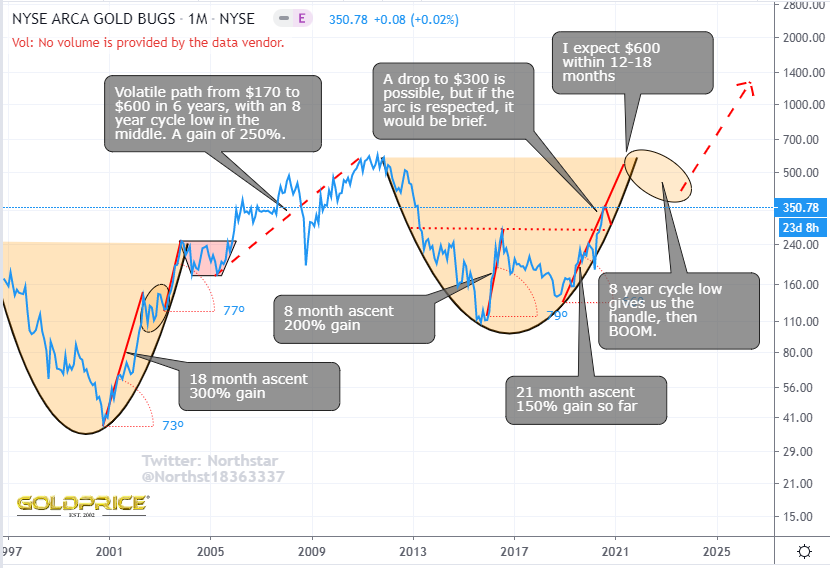
The cup formation would allow a short pullback to around $300, but a doubling to $600 is what I’m looking for in the next 12-18 months. In terms of time, that would position us with perfection to build out a handle into the 8 year low. After that we switch on the afterburners and break away from the gravity surrounding the cup…
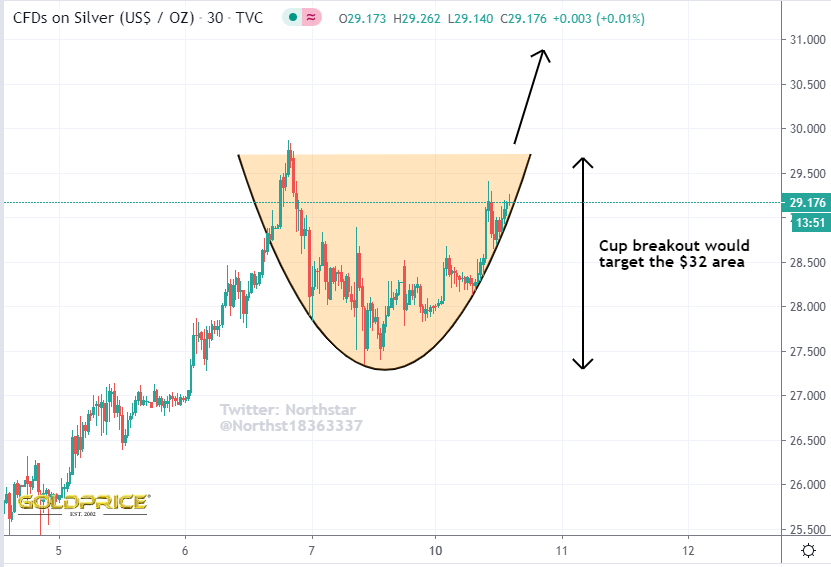
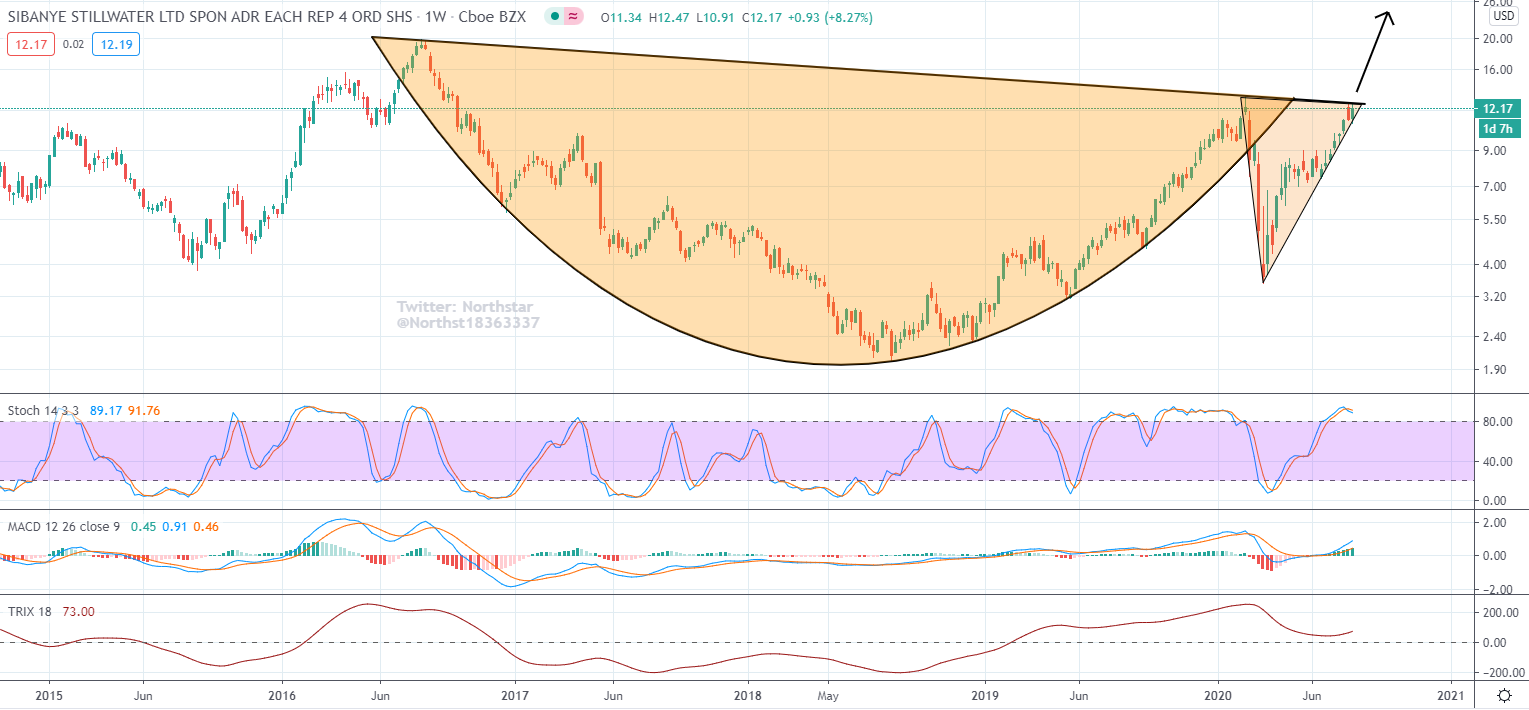
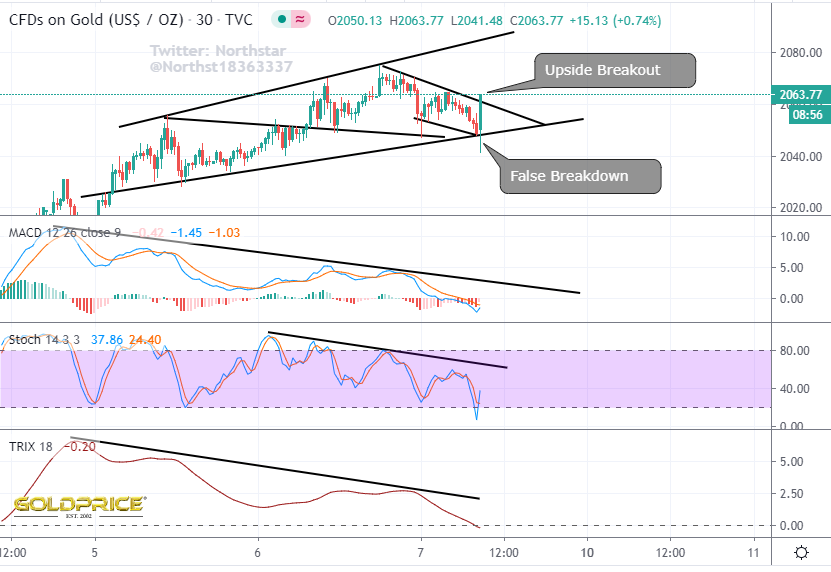
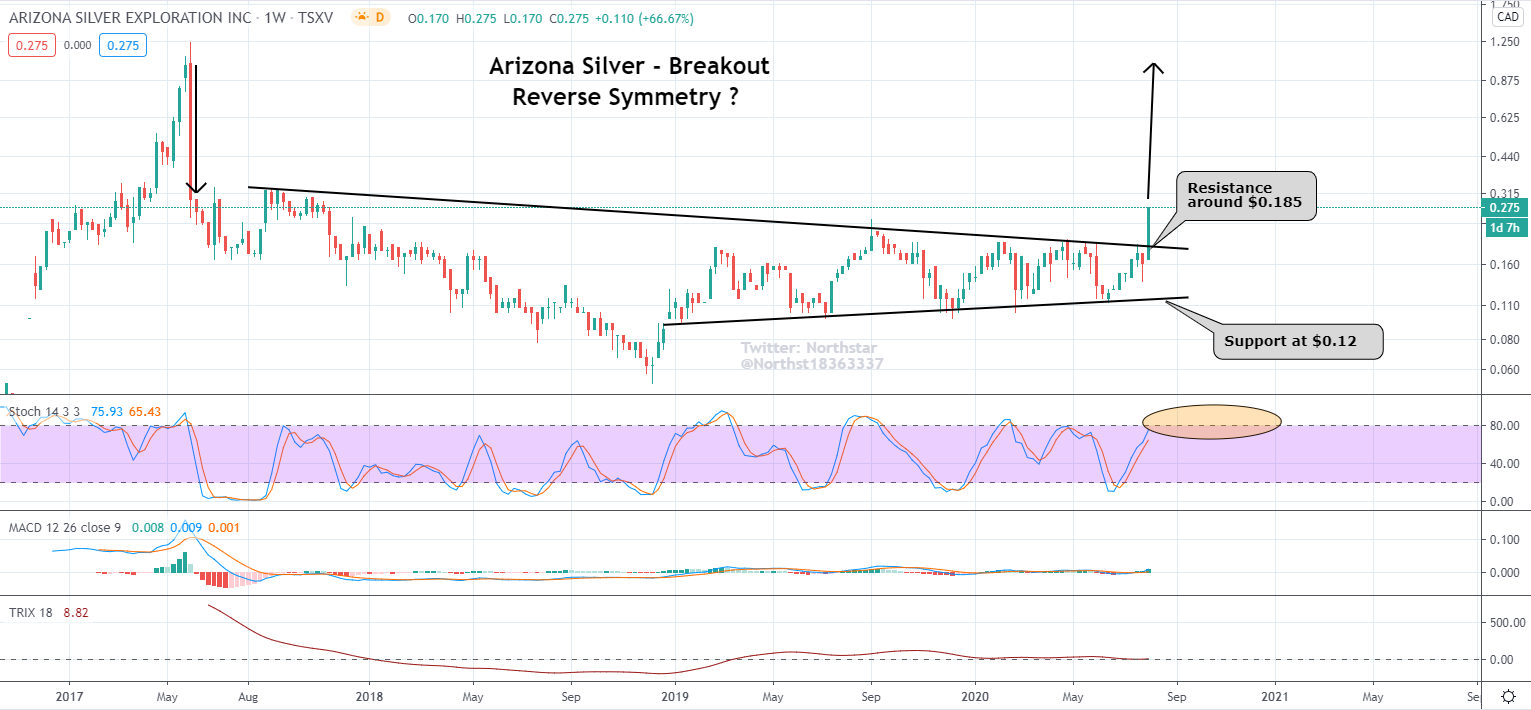
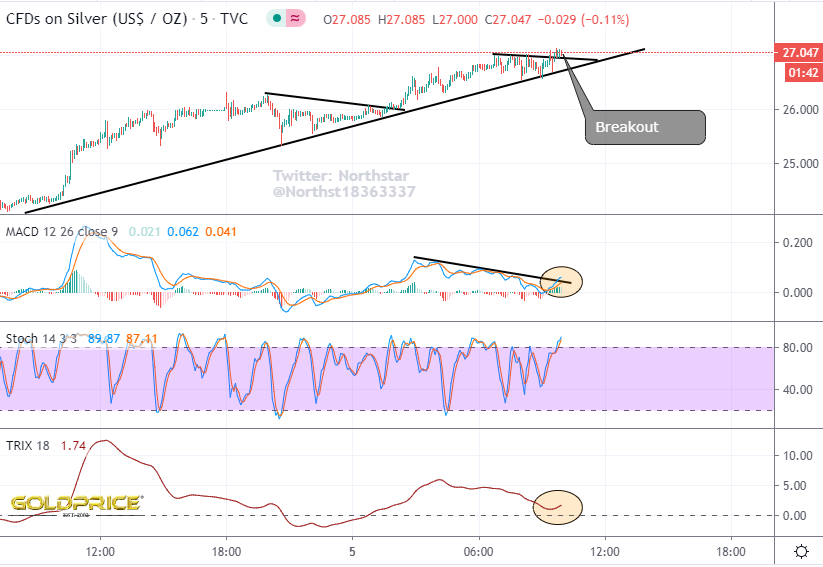
What a great ‘ false breakdown’ that was. We’ve now broken out to the upside. Negative divergance on the indicators…if they were to break through to the upside, things get crazy, or should I say crazier. What a ride this is turning out to be (and this is just the very start).
Down over 5% in the last several hours
There are so many gold and silver charts that look similarly bullish to this one
Edit… GDX chart added
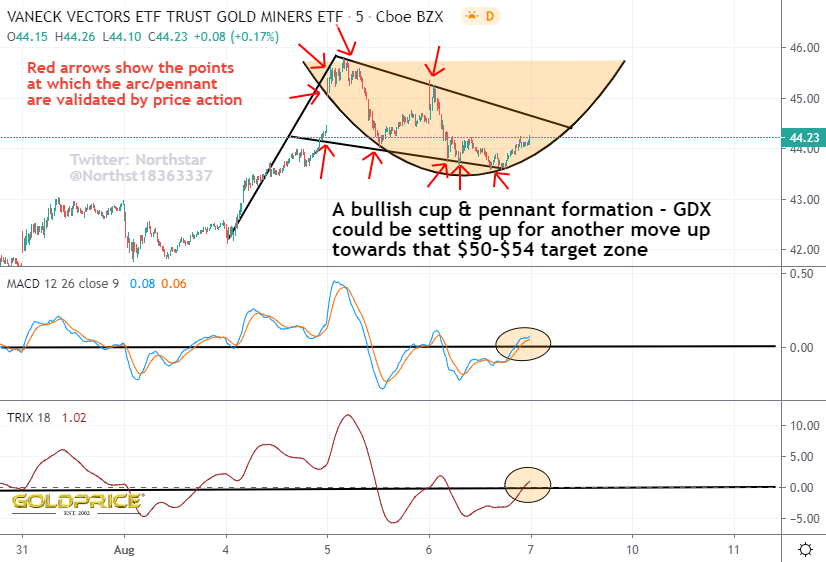
Regardless of any short term pullback, this one could take off so fast that people get left behind wishing they’d bought a ticket…
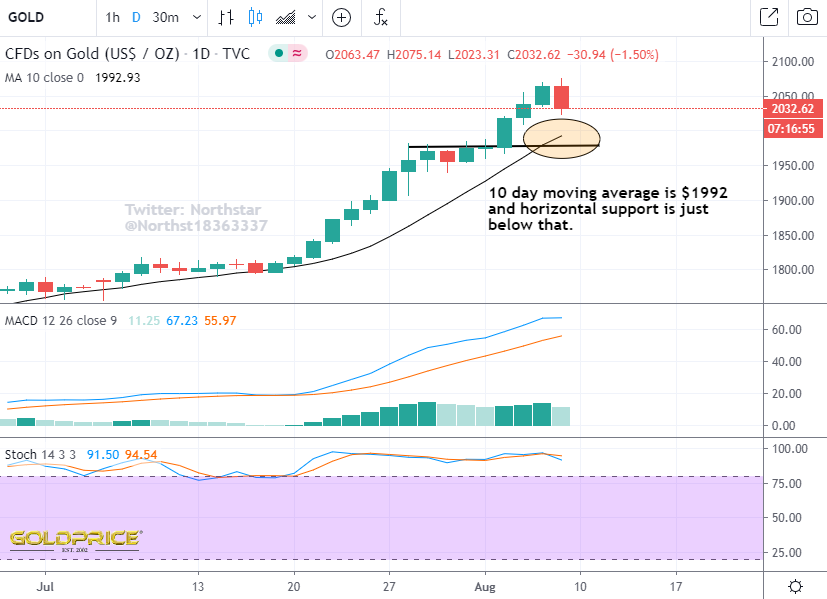
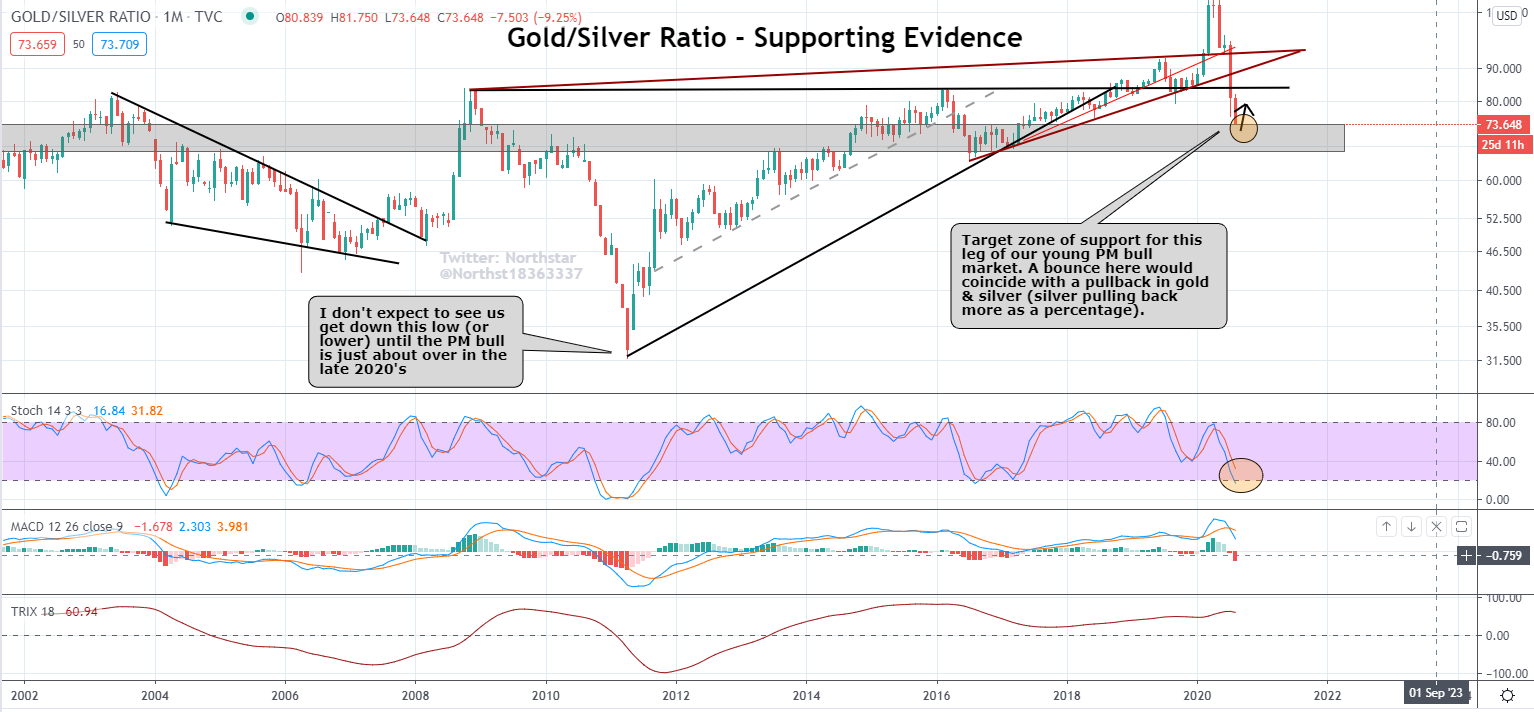
We’ve reached my support zone. A short term bounce is likely soon, but I wouldn’t expect it to last too long when it happens.
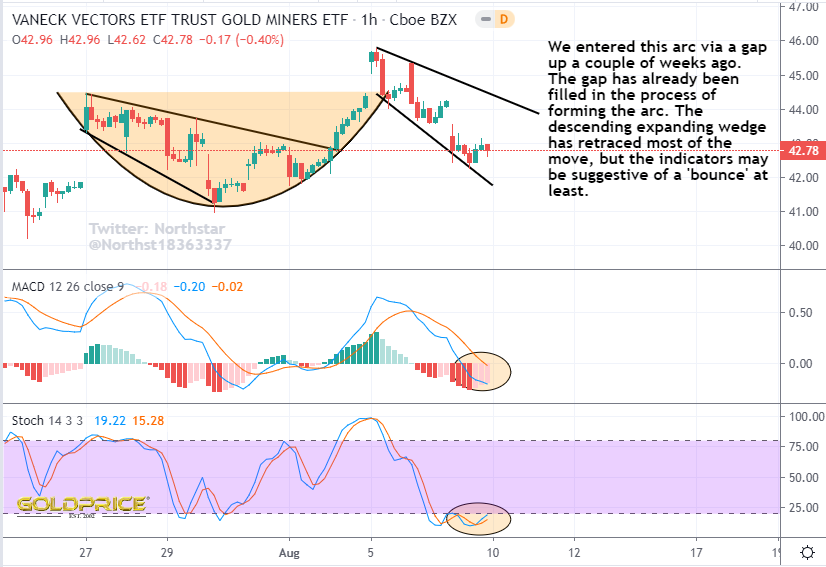
Well, as I suspected, that gap did get filled, and it’s not a very bullish looking chart now
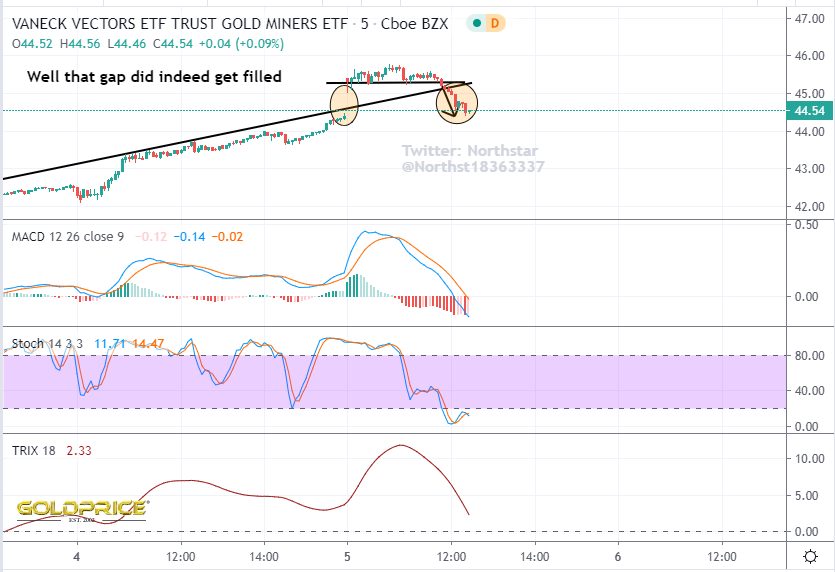
Here’s one possible scenario – apex backtest then down.
I don’t know, but from some angles, the gold/silver charts are starting to look a little ‘tired’. After such huge gains, I feel a little uneasy. The market loves to surprise, so maybe $2100 gold, $30 Silver and $54 GDX will have to wait. Made some great profits from this run, so I’ve just (in the last few minutes) locked them in and taken them off the table. That amounts to about 25% of my PF.
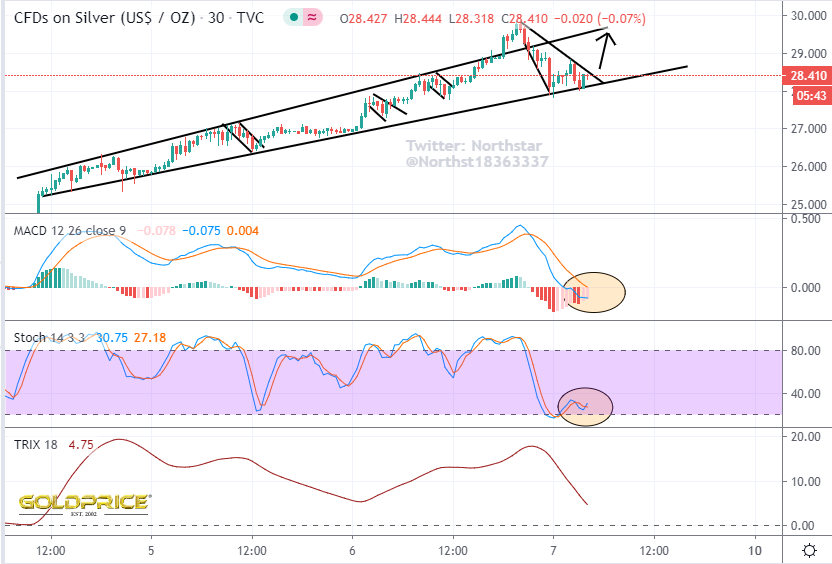
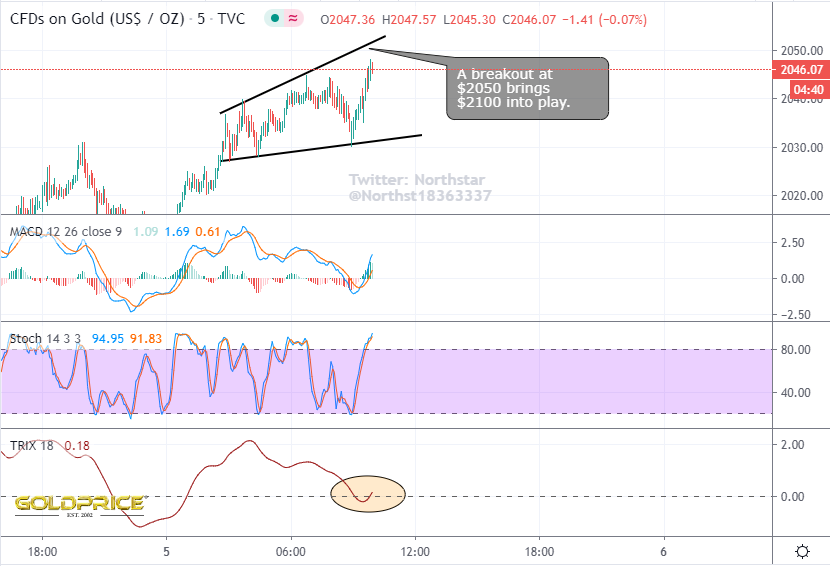
If gold moves above $2050, then $2100 is up next. Silver has just broken out yet again…
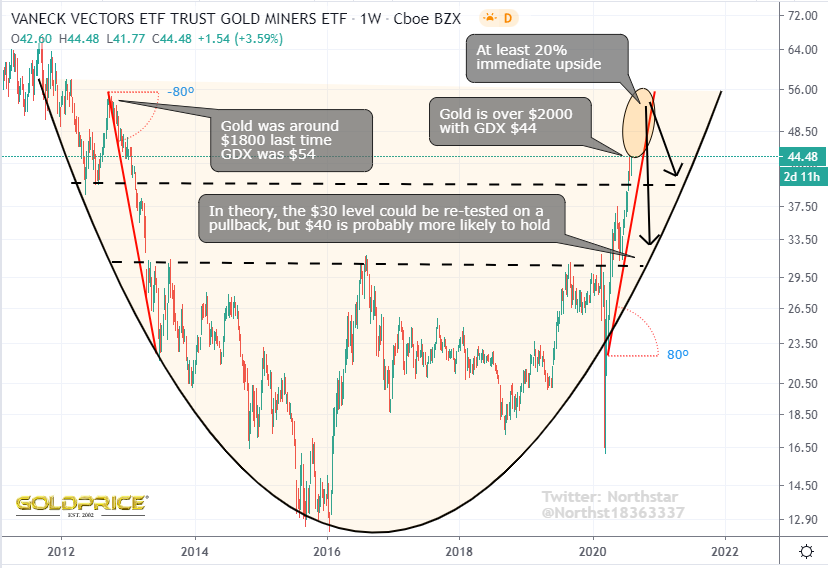
GDX is what has kept me from hitting that sell button so far – the chart is crying out that it wants to reach $50-$54 before correcting in a meaningful way. That would give around 20% more upside (the silver miners could be 30%+). It may happen in the next couple of days with gold closing in on $2100. I need to do more analysis, but that correction will come.
I have also updated the gold roadmap I posted earlier. It now includes a Fibonacci overlay which, quite incredibly matches those targets close to $3000. Weight of evidence is strongly pointing to that number. But when ? My current thinking is that once GDX achieves its target, we see a sharp correction (20-30%). After that gold should be free to climb to that $3000 target BEFORE the 8 year cycle low drags us back to $2000 in 2023 (remember, the drop into that low will start anything between 6 and 18 months before the actual bottom is hit). That would mean a 30% correction – very similar to what happened in 2008 (expect a global crisis). After the 8 year cycle low, it’s up all the way to (perhaps) $5000, but that is pure speculation at this point. We can reconsider all of this once we reach $3000. Hope this helps, and also worth remembering, all of this is my considered view of the MOST LIKELY outcome – there are other, lower probability scenarios. As long as we continue to chart and trade the data in front of us, and avoid fanciful theories/hype/opinions, the picture will remain clear, with the map laid out for us to navigate.