Precious Metals Bear Market Phase III Update
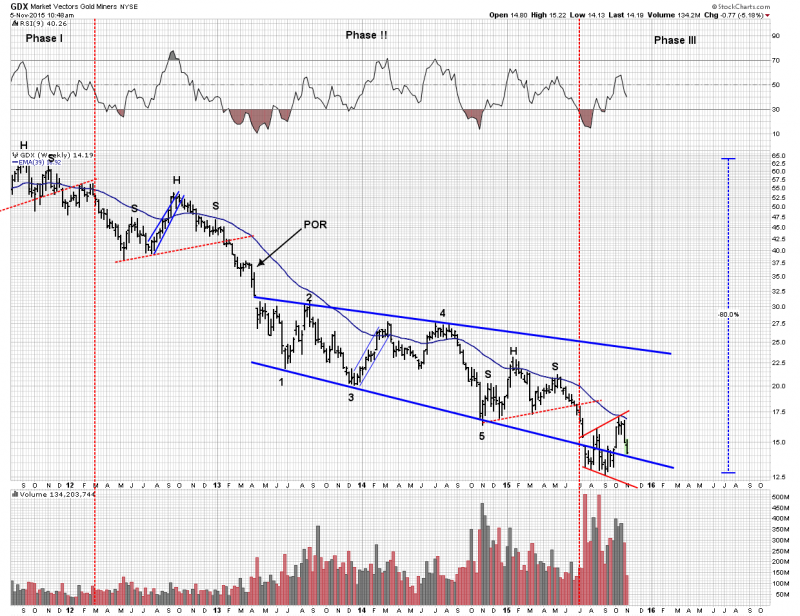
As we know labeling price action is an ongoing adjustment process in a bear/bull market. Here is my current interpretation and I compare it to the bear market of 1929-32. Note we have been down 80% so far where the depression ended up at 89%. I have a few observations and interpretations from the two charts. First off I am re-classifying phase III and its beginning from late last year to this past July. Seems the psychology justifies this as the action up until this past July is best characterized as chasing false bottoms and hope retention. Seems we are now set up for a potential full on liquidation phase. The BMR that we just finished up likely was the reload process required in order to provide fuel for a downward impulse. This would also fit in with the expected year end tax loss selling. The phase II Post POR consolidation has front and back bookends. That entire phase was isolated with a gap on both ends to define it
Rambus has provided enough commentary on the labeling and price action so I don’t have to add any here, however what I would like to contribute is the comparison to that deflationary bear market of the 1930’s. I suspect that the year 2016 may be the year of the deflationary impulse in the commodity sector. My expectations would be for gold to bottom first and start its bull market with the mid-tier producing gold stocks leading the way into the bull market. They are the most likely candidates as they are not burdened by debt as the majors are and their lower input costs will allow profits to pass through to the bottom line.
If you want an education on those 3 years that changed the world and how they effect markets I would recommend spending a lot of time with the following chart. Its a history lesson in a chart. The comparison is that this was the last deflationary impulse we have had so the lessons are there to compare.
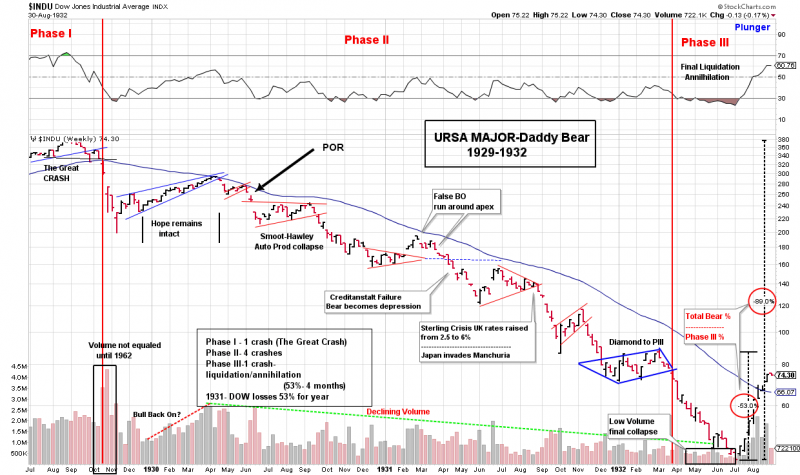
If you step back and look at the big picture the price action is that of a big downward curve which accelerates downward the further into the bear. Its as if the market was drawn into a deflationary vortex. Perhaps we will get the same finish with our current PM bear market as you can see the same curve can be seen to be in development in our current bear market, but is not yet completed. The next thing that really stands out to me is the increasing volume in our current bear. Now we all know that bear markets don’t end that way. They end with lower volume. I think that tells a tale and provides a big clue to us. Perhaps a final washout will cure the market of this enigma. Sure bull markets can launch with an explosion of volume as we see in the 1932 launch (also in august 1982), but we expect to see the bear end with volume trailing off. I have written on this before, and how the final phase III annihilation drive in 1932 was truly astounding as you can see from March-July 1932 it ended in low volume. The final bottom came with black pessimism and shocking negative market news without the stocks declining any further. We don’t have that yet as demonstrated by todays news of the RGLD earnings miss with the stock off 14%. Also my personal bottoming system that I have developed still points down for this bear market. May I suggest that we may finally indeed be at the launch of true annihilation? Certainly, we have had enough already to attach that label, but maybe what lies ahead will fulfill all possible levels of definition of a capitulation event to include not only issuer capitulation but also retail comical selling. Something we have not yet seen in this ridiculously destructive bear market.
Hold on knights, keep your powder dry and keep honing your buy list, the end is nigh.
An interesting side note and observation is that I am on record for a final low print in the HUI of 66. (the devil bottom). This would be a final phase III annihilation liquidation drive of -53% from its recent peak of 140. Look where else this number crops up…. The final 4 month drive from march to July 1932 was also -53%. That’s why it has been one of my themes not to go long early in a bear market because phase III can be so destructive. That final phase in 1932 incurred larger losses than the infamous crash of 1929 or 1987.
As always, great work…
its “go time”
Also, to me the Euro’s behaviour from 2008 to 2015 reminds me a lot of gold’s behaviour from 2011-2013: it has only just had its collapse or point of recognition (POR) into phase 2 of its bear market after the 7 year phase 1 bear market trading range.
http://stockcharts.com/h-sc/ui?s=$xeu&p=M&yr=25&mn=0&dy=0&id=p84715185119&a=422997387&listNum=1
The Japanese yen may have already had it Phase 3 crash after the Phase 2 consolidation following phase 1, all on a quicker timescale from 2012-2015
Gold is halfway inbetween, just substitute $GOLD in the URL.
Phase 2 is at and end and phase 3 may be under way.
However, I don’t know whether phase 3 always happens. If you look at some gold stocks, it has already happened but in the strongest gold stocks like Franco it has been less obvious because there has been a good bear market rally. However the recent gap down below $48 looks like the possible start of a phase 3 crash, perhaps (same chart with FNV substituted for $GOLD or $XEU)
All very interesting. Phase 1/2/3 bear market theory courtesy of the Plunger GT Webpage!
Quote: “Big downward curve which accelerates downward the further into the bear”
Here it is!:
http://goldtadise.com/?p=355165
Wow, I didn’t realize that my chart from there looked like your Dow 1929-32 chart. That is scary!
Poo. Too late to sell physical! Well, almost.
Oh, then $800 gold looks inevitable?