Proof That Gold is Near to Hitting the Wall
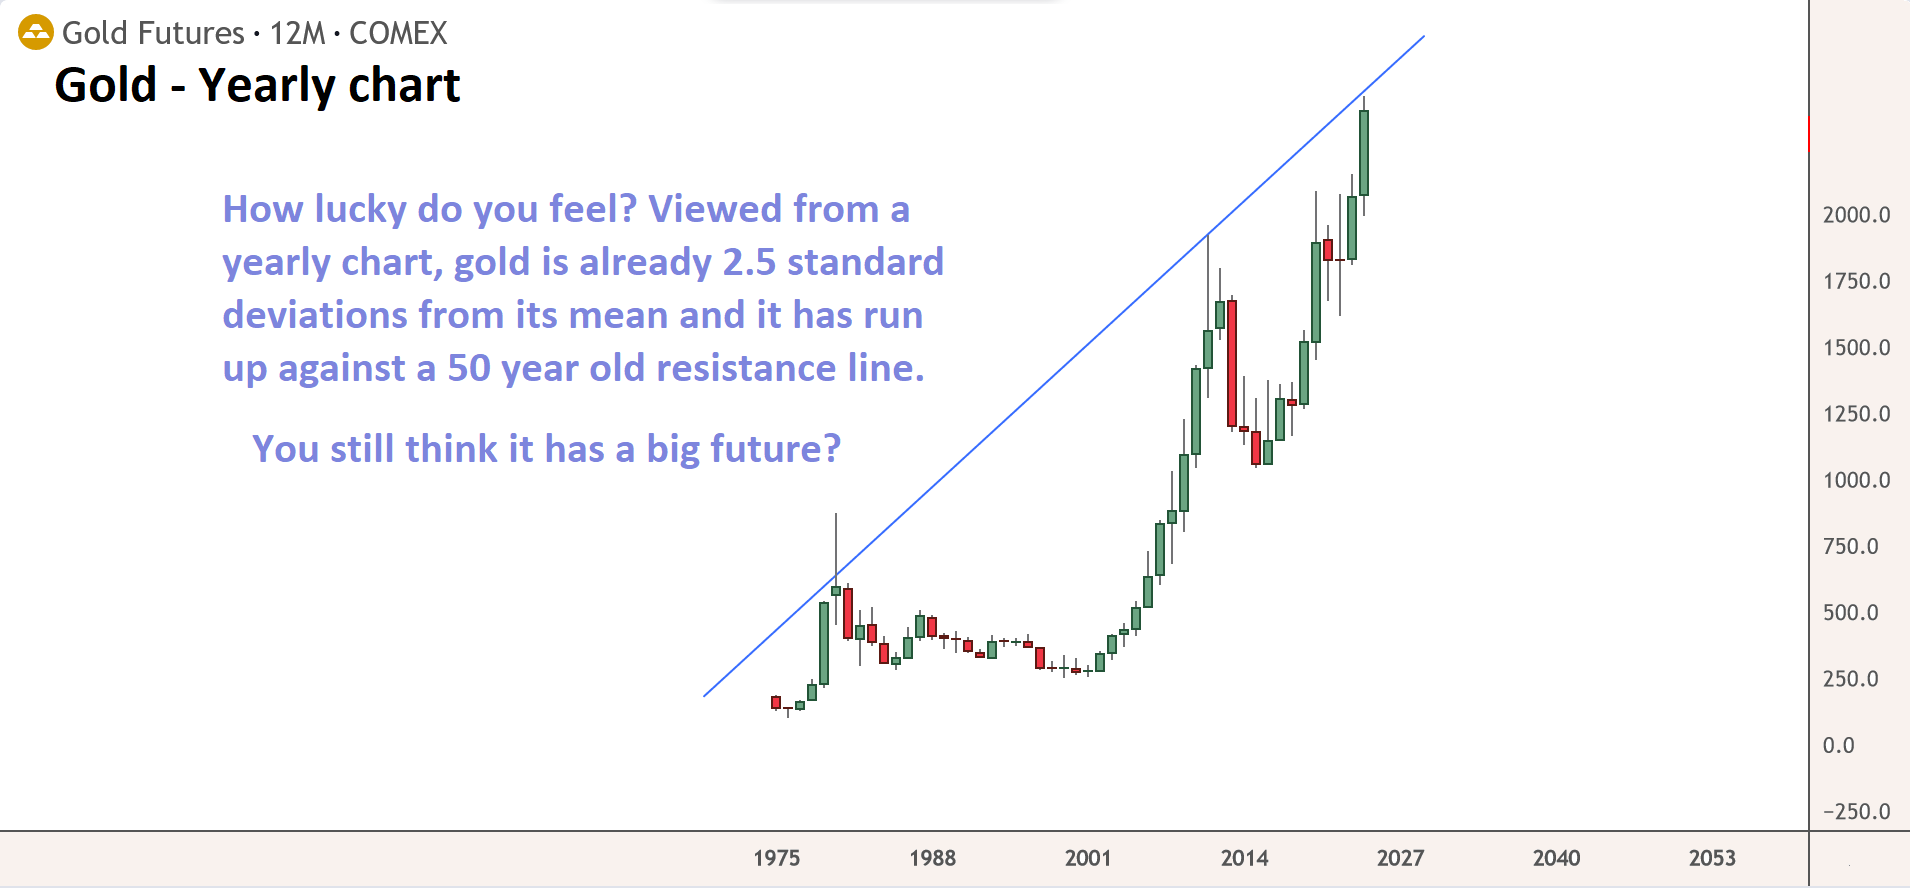
Here is a yearly chart of gold for you to examine. It is evidence (based upon a common technical approach) that gold has almost reached a top from which the only future movement will be price declines. Everything has a limit. Golds is at the 2.5 standard deviation mark of a yearly chart. That does not mean it cannot shoot higher and put in a spectacular year to finish up this cycle, but it does mean you should think twice before investing too heavily in the stuff because the technicals warn we are near a termination top.
As an aside, I want to point out once again that it is deflation that is in our cards for the future, not inflation. I include asset deflation and commodity deflation among these forces. I realize that is contrary to the popular narrative but the charts do not lie. There is a long decline that lies ahead as the credit cycle winds down and finally pops and its forces will affect just about everything that is currently overpriced. Including gold.
Houses, gold, bitcoin, coffee, cocoa and you name it. Everything is currently in a speculative bubble.
Farmer – I would suggest you plot gold’s price on a logarithmic scale. Long term charts should always use logarithmic scales. I believe this will significantly change the look of the chart and show gold has more room to run than your current chart suggests.
No question gold has further to run Ken. But a log chart won’t change the fact we are near the long term price highs. I understand your disappointment though and expected to hear it expressed. Nobody wants bad news about something dear to their hearts.
And the value of the dollar is being diluted by the creation of trillions of dollars every year! The dollar is no longer a reasonably stable yardstick to be measured against. Is gold and all the other commodities really increasing that much when true monetary inflation over the years is factored in?
Here is an inflation adjusted logarithmic chart of gold prices. Much different picture than your chart presents.
https://www.macrotrends.net/1333/historical-gold-prices-100-year-chart
Yes its a different picture. Indeed it supports my case. Notice the cycle top from 2000 to 2012 did not exceed the prior high. That is exceedingly bearish and points not to a future of further price highs but rather to an impending and inevitable bear market.
When I look at the chart I see about $800 gold peak in the 1930’s, followed about 50 years later by another peak which tripled in price (~$2,500). Fast forward another 50 years to now, and another peak triple in value would put gold around $7,500. Good point though, nothing rises forever. Thanks for making us look at this.
The Fed is cornered. They want to keep the banks afloat, and will do everything they can to keep the bubble expanding. Because they can see that letting just SOME air out, unleashes the dynamic in reverse. Selling begets selling.
But the pitchforks are also being sharpened, as fiat devaluation unleashed by the Fed and other CBs takes its toll.
We either get hyperinflation acceleration. Or financial system implosion.
The regional banks are the canary …. fiat deval requires higher nominal rates than what Ctrl-Peeing has allowed. Let THEM eat cake this time!
Pick your poison.
AKA… Wall of worry porn