SPX (EW & 5D)
Very extreme momentum readings for SPX monthly on my charts for June.
They reminded me of readings from late 2007.
In EW land, peak momentums usually correspond to internal wave 3 of larger wave 3.
In Sam’s chart below, blue 3 within red 3.
Suggesting TWO more legs up and momentum divergences at each those further highs (red 3 and red 5).
The way the math works, those momentum readings are already SHARPLY lower for July with crossovers likely on deck.
(eg, 146 to 99, and 100 to 81 for several of them)
So look for a corrective decline to start later this month as red 4.
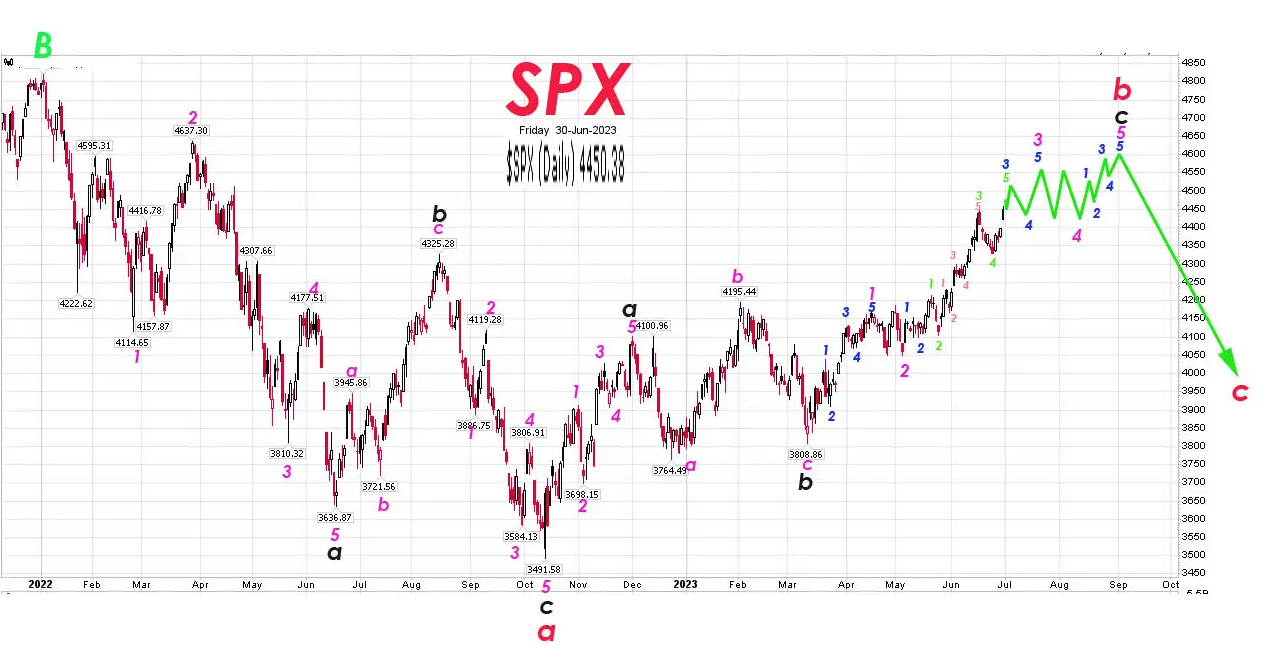
One comment on Sam’s count.
Green b in the left corner, coupled with a corrective downward internal count (red a b c), can only mean two things.
Either Sam is wrong, or we are in a long term (multi decades) triangle. (Green abcde; a was 2009)
Because Green c (which he has us in) can only be an abc internally (red) if the larger structure is a triangle.
C waves are always five wave moves, with this exception.
If correct, its a market for traders not investors, nor doomsayers.
(former Tenter) CD weighs in from Thailand.
https://www.tradingview.com/chart/ES2!/kSAgbmq6-This-is-actually-getting-insane/
Pretty Convincing
Good stuff Thanks pedro