July 30th 2020, Silver Chartbook – When in doubt, zoom out
When in doubt, zoom out
Silver, Monthly Chart: A Clear View
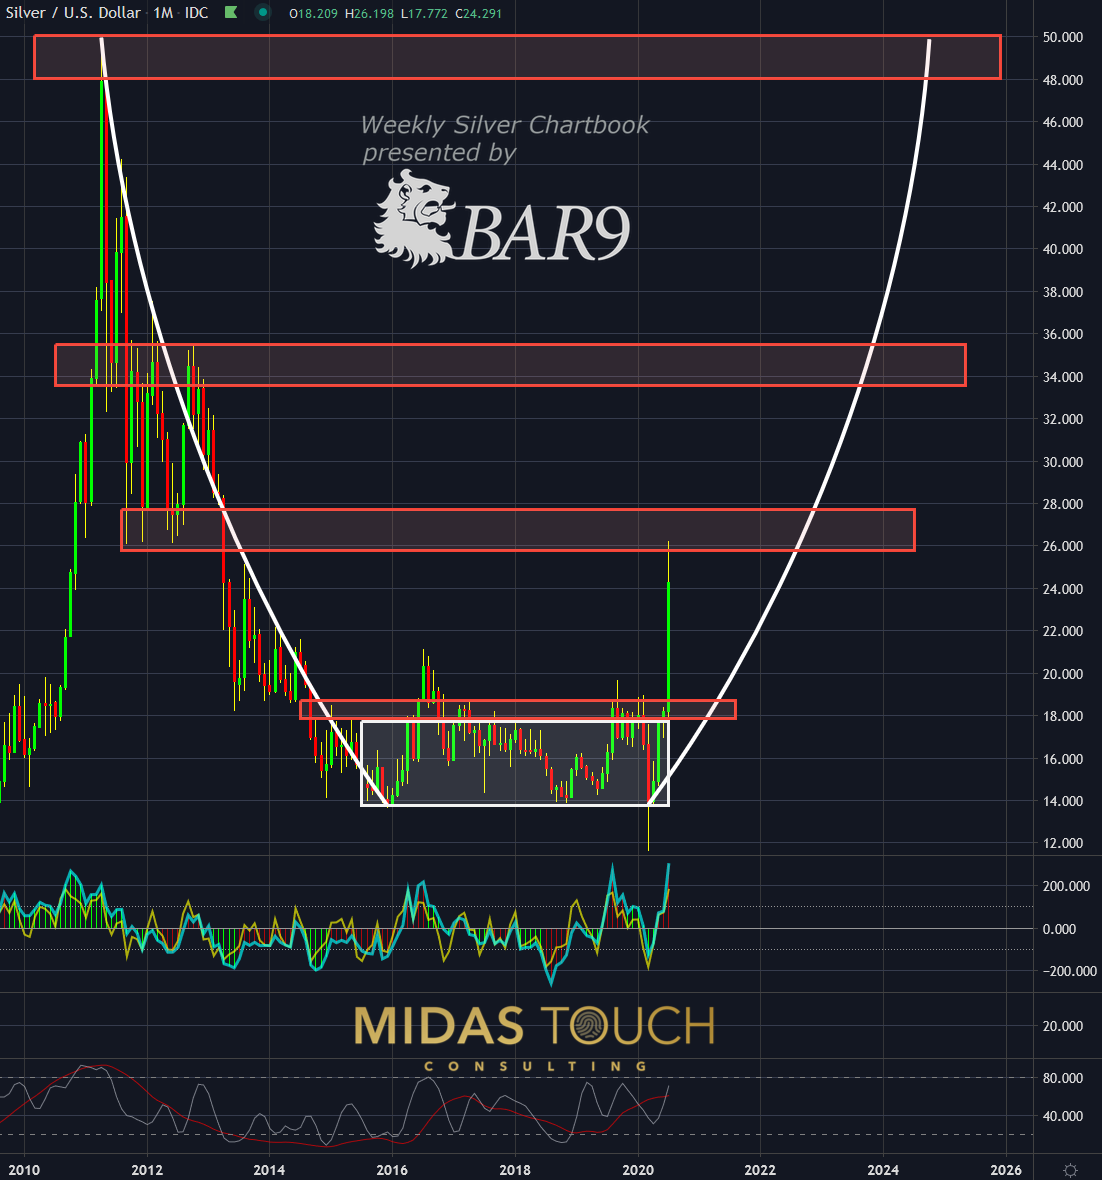
Silver in US-Dollar, monthly chart as of July 30th, 2020.
As indicated in the last silver chartbook release, we have broken through a seven years sideways zone (white box). From a higher time frame perspective (monthly chart) there is possibly quite a lot more room for price to go. This means you want to be focused on weekly and monthly charts and not get swallowed by daily chart time frame volatility that has been pushed from lower time frames up and suggests emotionally you get in our out. Volatility can be used for exits that are set in place already but are rarely a low-risk opportunity to get into a trade. The mind needs to be restful and very calm at the time of execution.
News should be the last driving force to awaken the executioner in your personality. Too often at the situation of silver right now investors ask themselves questions as to where to get out or where to get in on the next retracement to only find that these retracements aren’t as deep as they hoped for. Fear of missing out can be a true challenge.
Looking at the monthly chart above it needs to be clear how you want to participate in the directional move now set into motion. You want to be prepped and not find yourself in an emotional reactionary state towards the price behavior.
Silver, Monthly Chart: Time Relativity Error
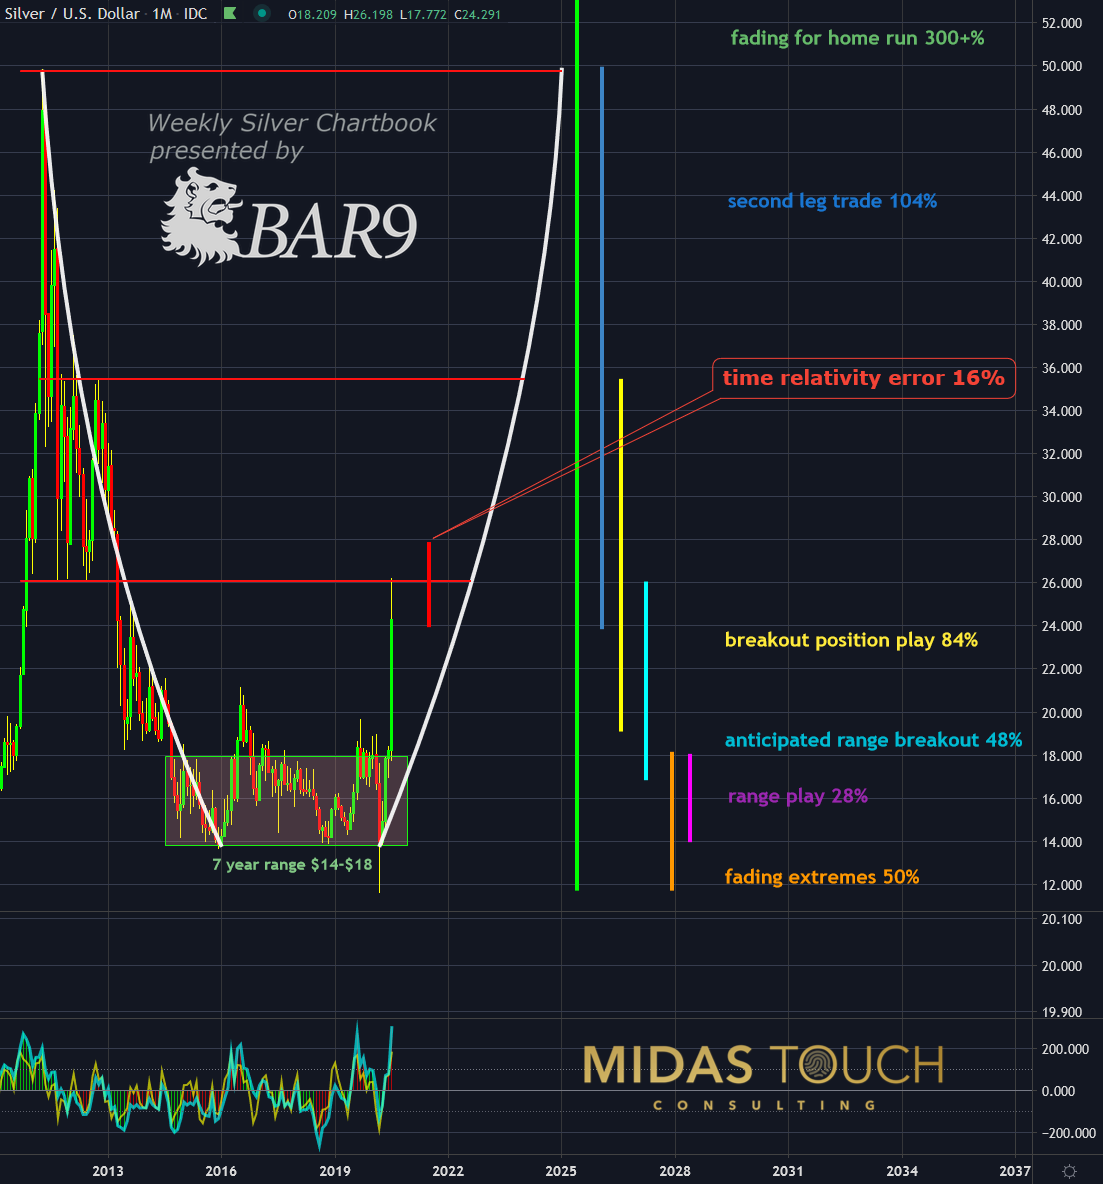
Silver in US-Dollar, monthly chart as of July 30th, 2020.
This monthly chart depicts what most often can happen if you trying to chase price. Having missed low-risk entries on the first leg, once the whole world is looking at the results of the first breakout at a specific instrument or market, traders try to get in. Fear of missing out drives aggressive market participation at exactly the wrong time. Even if they get the entry right they most often cash in way too early shortly after? Most importantly they are not aware of what time frame they are trading. They find themselves soon again without a position and in desperation on how to get in again. The result: stress and small winners at best. After some time they ask themselves, why didn’t I just buy at twelve and hold the position towards fifty. That isn’t that easy either but with a detailed plan and pre-prepped clarity on what to trade and in which timeframe, results might improve.
You see to the right the various plays possible (among others). We also made approximate profit results shown on silver specifically for comparison. In this specific case, we were able to participate in each variant of these setups. We posted all entries and exits live in our free telegram channel. The isolated trade: “time relativity error trade” is a valid trade which we call a “reload”. This only if traded in addition to other setups.
Silver, Weekly Chart: When In Doubt Zoom Out
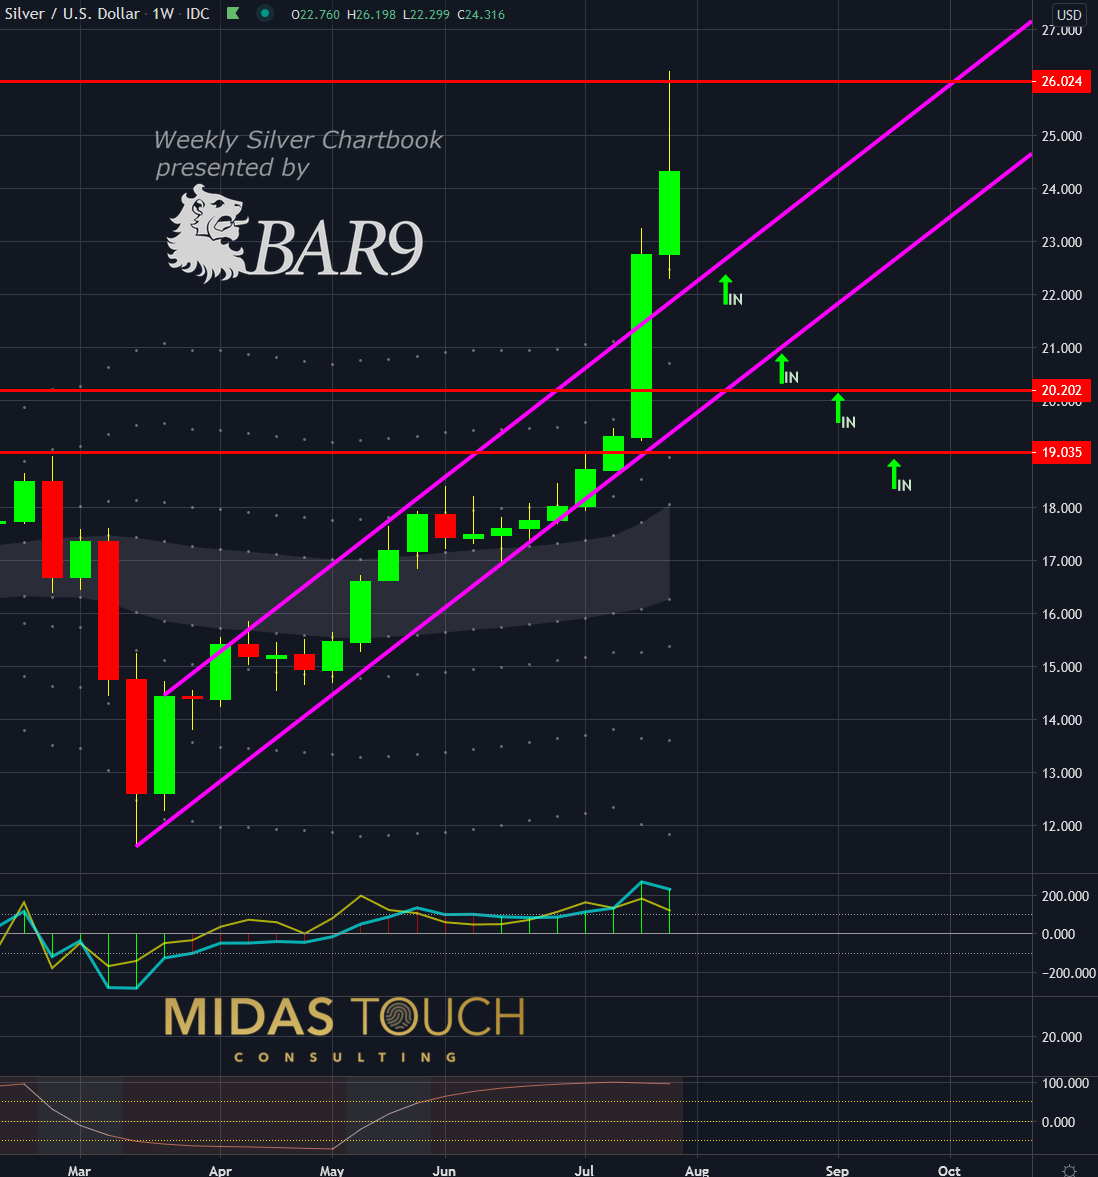
Silver in US-Dollar, weekly chart as of July 30th, 2020.
The weekly chart shows how far prices have stretched upwards. We have left typical standard deviation levels. Prices also have penetrated the upper boundary of the trend channel. A distribution level near US$26 has prices temporarily rejected. Nevertheless, the underlying tone remains very bullish and the trend could already continue from here. Alternatively, a double top forms as the second most probable likelihood and only on position three from the statistical percentages we might see a deeper retracement from here. For this scenario, both upward trend channel lines are low-risk entry points, as well as slightly above the round number of US$20 and the seven-year channel breakout line of US$19.
When in doubt zoom out
Our quad exit strategy provides emotional relief when in doubt about where to exit through its pairing out methodology. One excellent way to gauge the market and even more one’s emotions is to assume a contrarian position. A way to zoom out from one’s emotions.
Easier said than done since one is emotionally biased holding a position. This needs a bit of practice. We recommend daily exercise to spend a few minutes before each trading session. Assume after glancing at charts of how it feels to be either long or short or out of the market. Truly evaluate how each of these three positions makes you feel. If it feels good to have a contrarian position to the one you are holding take some partial profits. If not just relax and hold on to your position for a bit longer.
We post real time entries and exits for the silver market in our free Telegram channel.
If you like to get regular updates on our gold model, precious metals and cryptocurrencies you can subscribe to our free newsletter.
Very nice, thank you!