June 12th 2020, Silver Chartbook – How long and how high
Silver, Monthly Chart: Building A Position For The Long Term
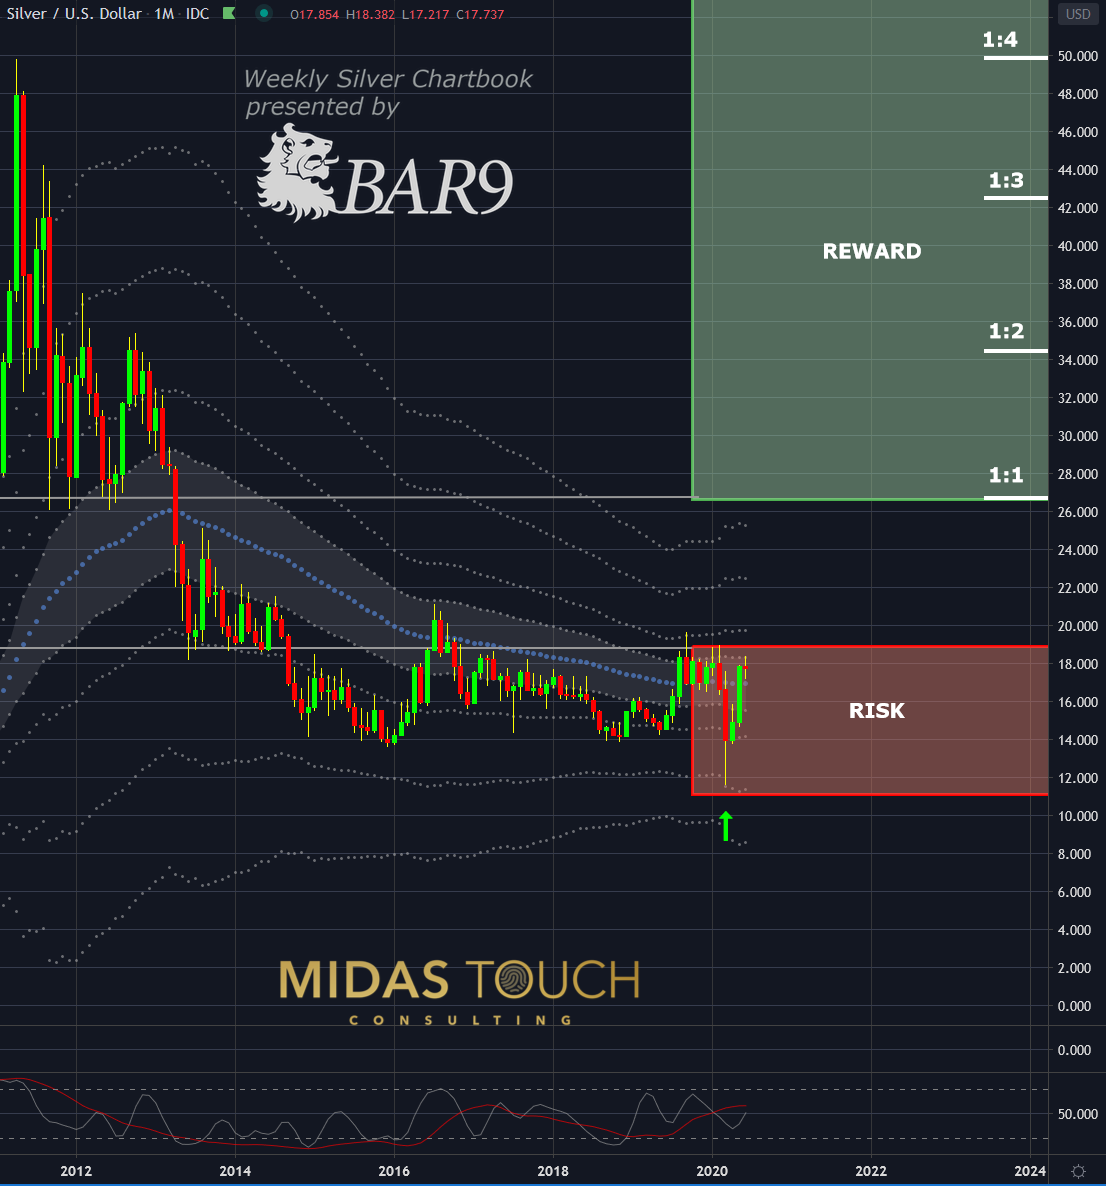
Silver in US-Dollar, monthly chart as of June 11th, 2020.
If you look at the monthly chart above you will find that even the worst fill price for a long position within the red zone finds a risk reward ratio of a minimum of 1:1 in the green bracket. We set that as our minimum standard for trades for our financing target (see our quad exit strategy). As the chart shows there is plenty potential for trade development even if Silver “only” retests its highs from 2011. A target we find quite reasonable.
On March 19th, 2020, we shared with our Telegram members (see our free Telegram channel) that we find Silver, at the time trading below US$12 to be at a good time to acquire physically. Already a few days later the physical price for Silver moved away from spot prices and premiums exploded. We still advised the purchase of Silver to long term investors. To many it felt uncomfortable to pay up such a premium.
However, we were comfortable to pay up to US$19 for well known one ounce Silver coins like American Silver Eagles, Austrian Philharmonics and Canadian Maple Leaf over the following weeks. Why? Because for the truly long term wealth preservation the entry can be a variant. Hence, already now while the spot price of Silver is trading near US$18.00, some of these coins trade near US$30 on the open market. Even if the gap between the actually physical coin price and the spot price should narrow again, the factor that essentially matters is the risk reward ratio. A discrete bank independent insured and audited Swiss vaulting facility can improve your risk reward ratio dramatically as you save yourself some of the premiums and the potential VAT on your physical Silver investments.
We are famous for our extreme low risk approach in regards to entries and their relative stops. It is of utmost importance to realize where the true risk is in these long term physical holdings. Wealth preservation needs to address the risk of the value of fiat currency, which is nothing else but an underlying belief. This is one of the core reasons why we have such a scrutinizing look on Silver, with there being a limitation of products that ensure ones monetary well being in the future.
Monthly Chart, Silver: Projections Of How High
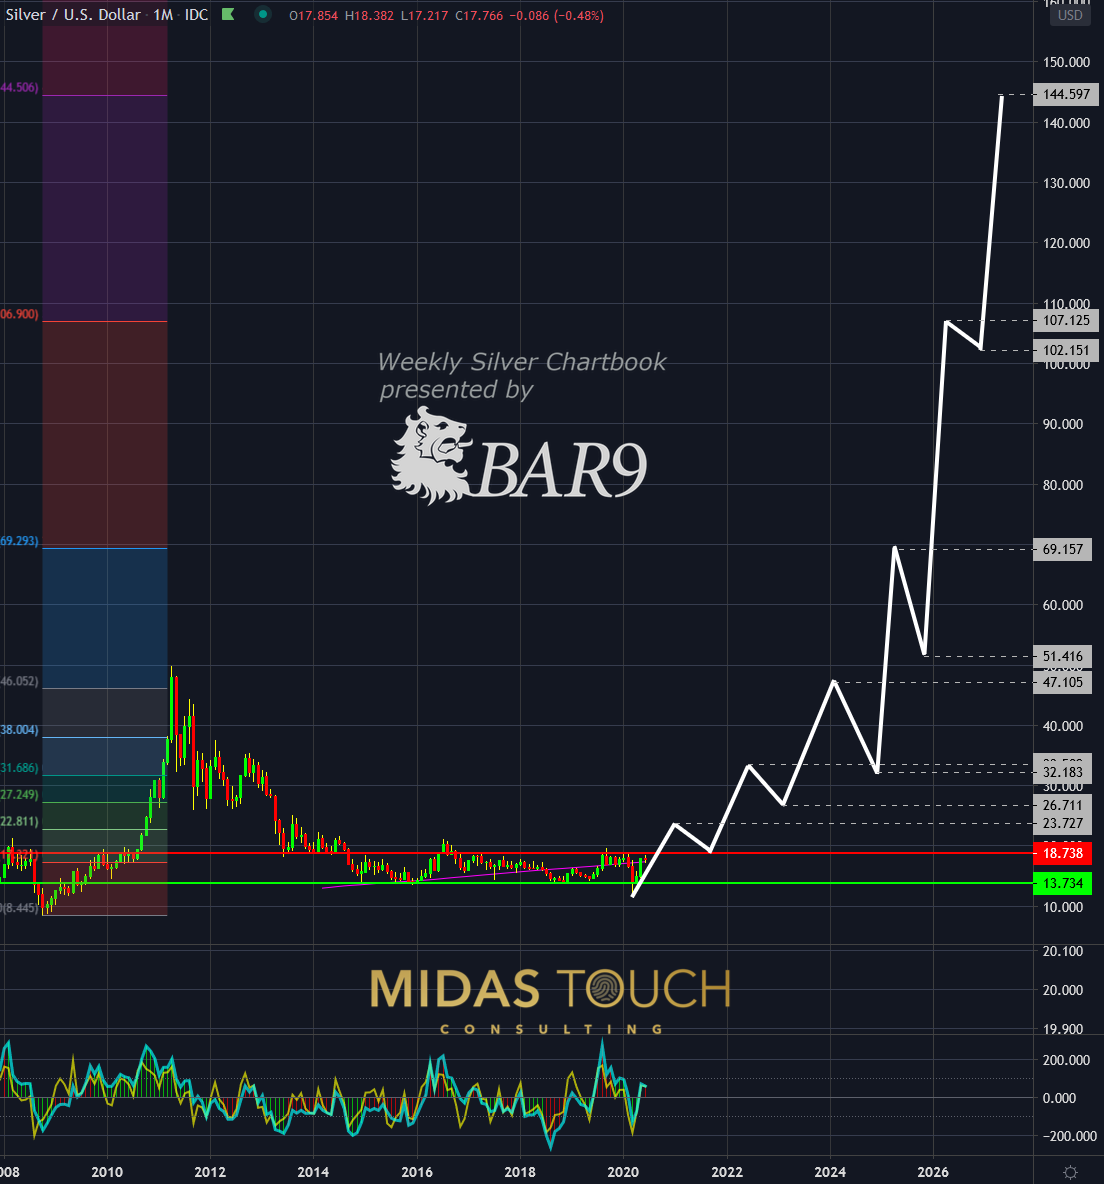
Silver in US-Dollar, monthly chart as of June 12th, 2020.
Let us have a closer look of what the future might bring. For nearly six years range players had quite a ball buying near US$14.00 and short selling near US$19.00.
Once US$19.00 breaks, we could see advances quite swiftly. The white line illustrates how we envision such a price movement. We perceive quite frankly a lot higher price levels for the very long term.
We do not want to evoke greed with this portrayed possibilities. Quite the contrary. We want to emphasize that a small starter position even at a price that on smaller time frames has seen some recent advances, is in context still very conservative.
Silver, Monthly Chart: Projections Of How Long
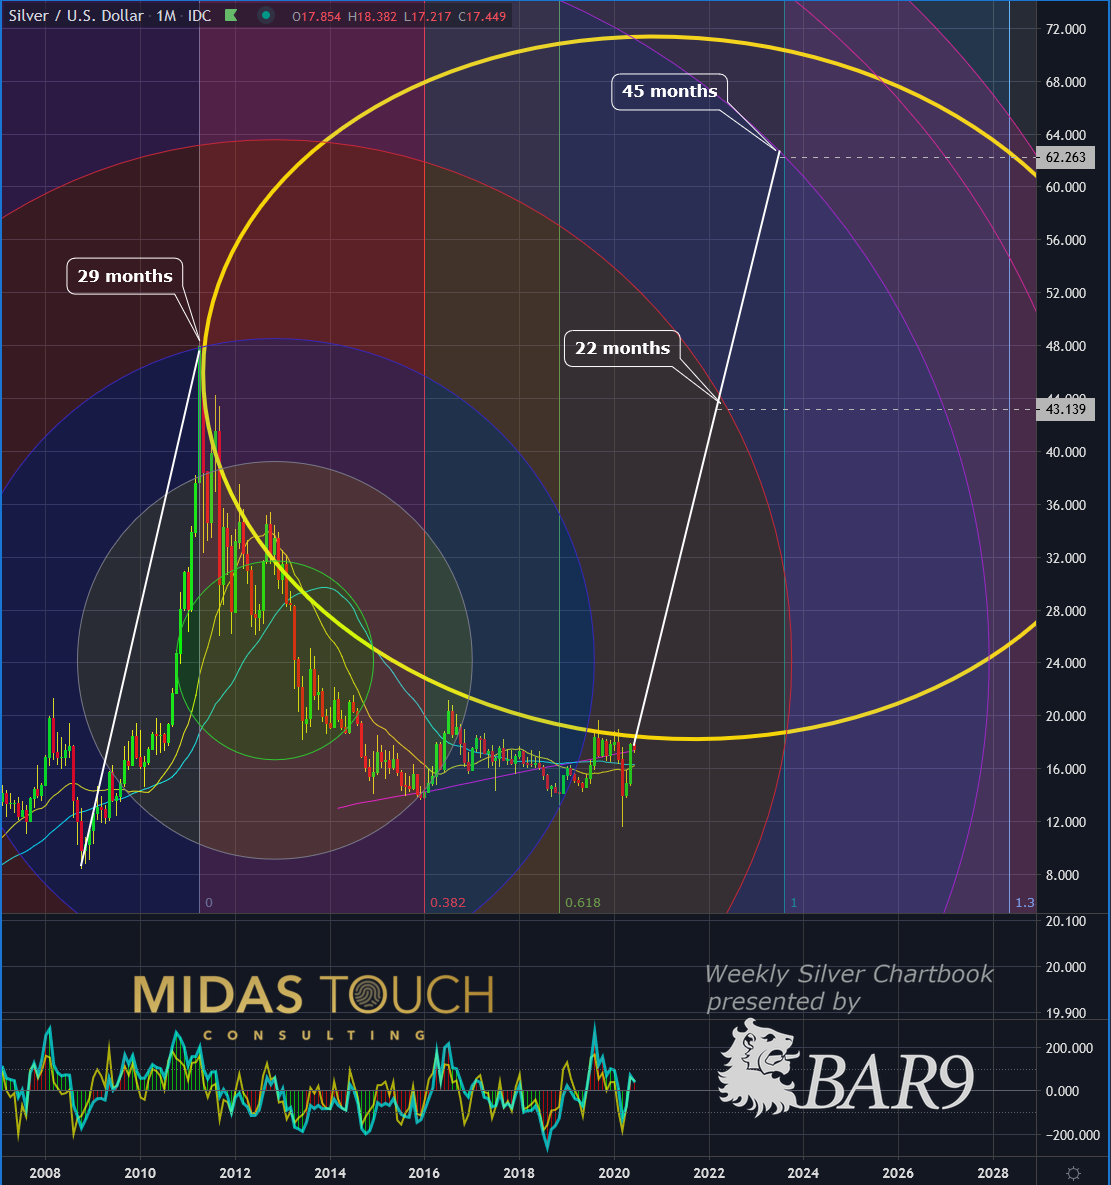
Silver in US-Dollar, monthly chart as of June 12th, 2020.
Time in itself is quite a different animal and so it is in trading as well. Here is where analysis becomes speculation to a higher degree. Nevertheless we are confident with a certain probability that prices might see within 22 months advances in the Silver market that reflect a 3.5x from our entry point, and about 45 months before we hit our second monthly target.
How long and how high
In principle the further out in time a guesstimate is attempted the less likely its’ accuracy. Nevertheless as a speculator this task needs to be mastered to the point to be accurate more often than not. So are we still advising to buy? That depends on your risk appetite. If you do not hold any silver at all and if the above mentioned numbers are in congruence to work for you as an expectancy than the answer is definitely yes. With fiat currencies at risk and the highly uncertain future of markets we find risk reward ratios even below 1:2.5 what we typically expect from a trade like this acceptable since in this case it isn’t all about getting rich – it is much more and primarily about wealth preservation.