GOLD and SPX Monthly
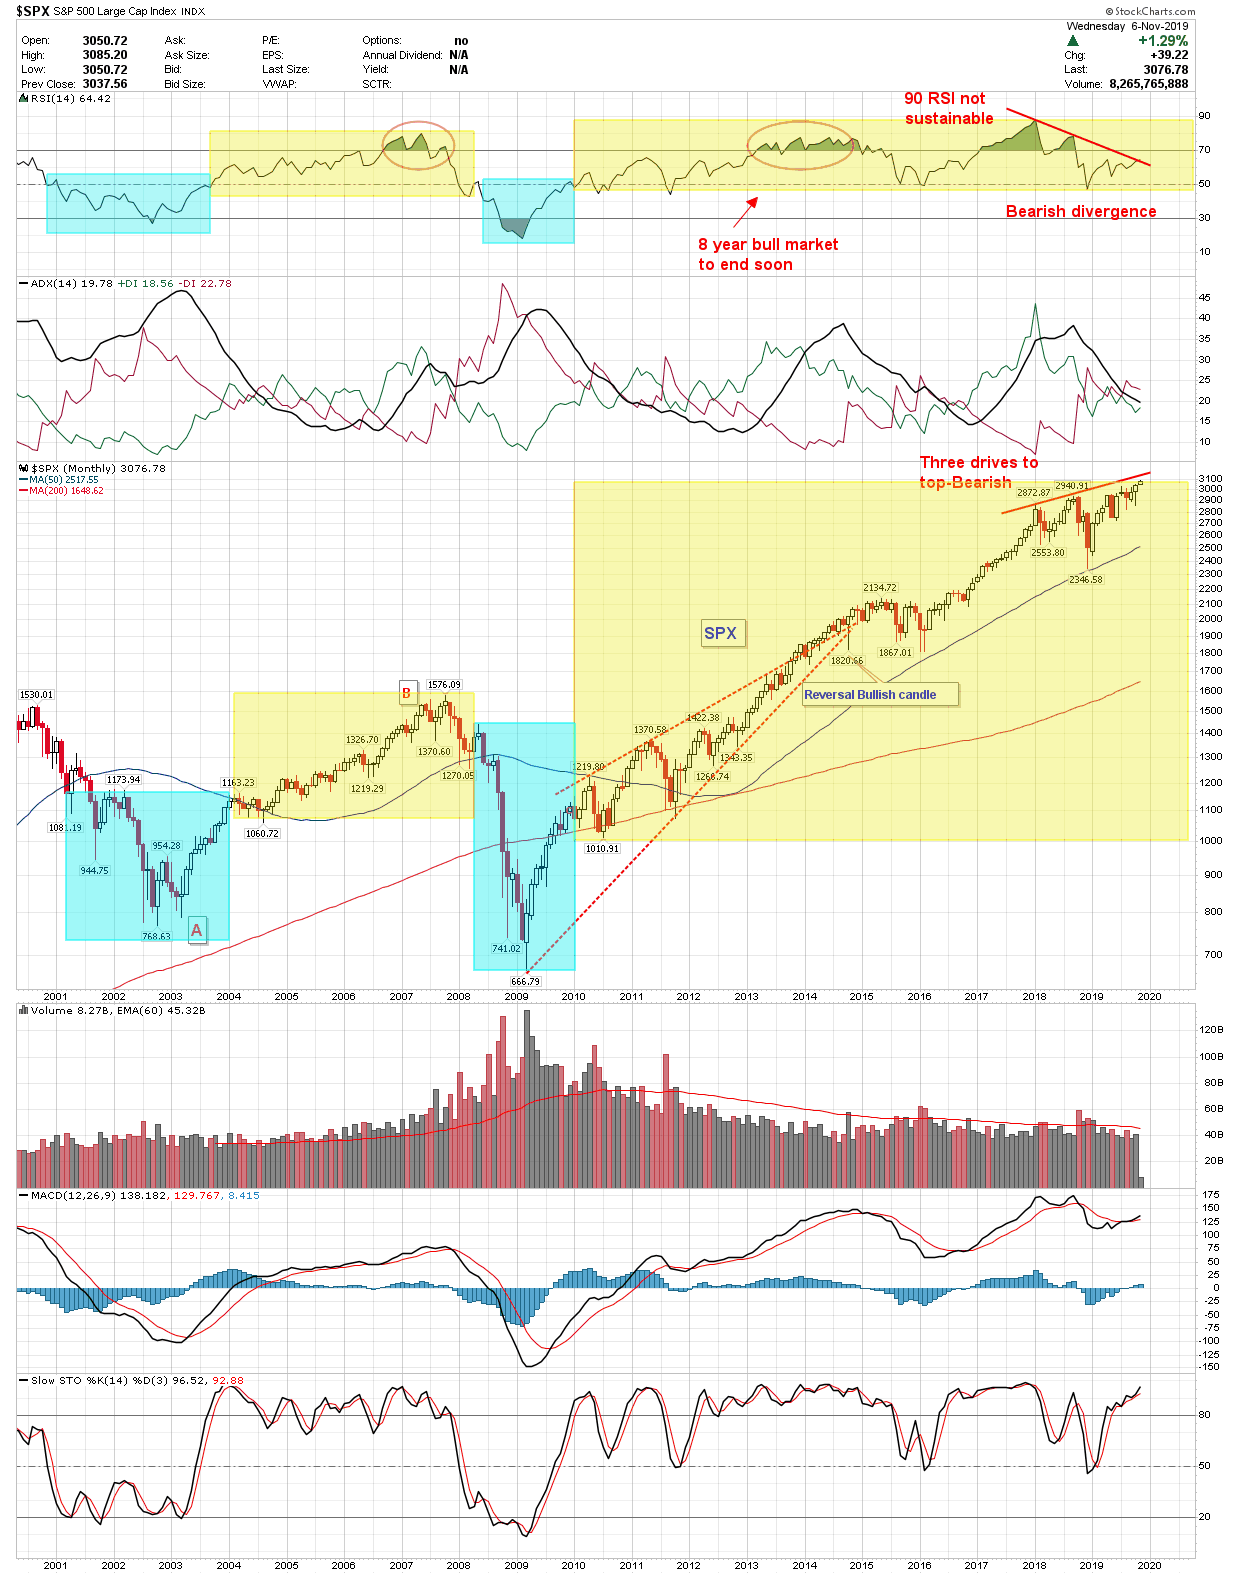
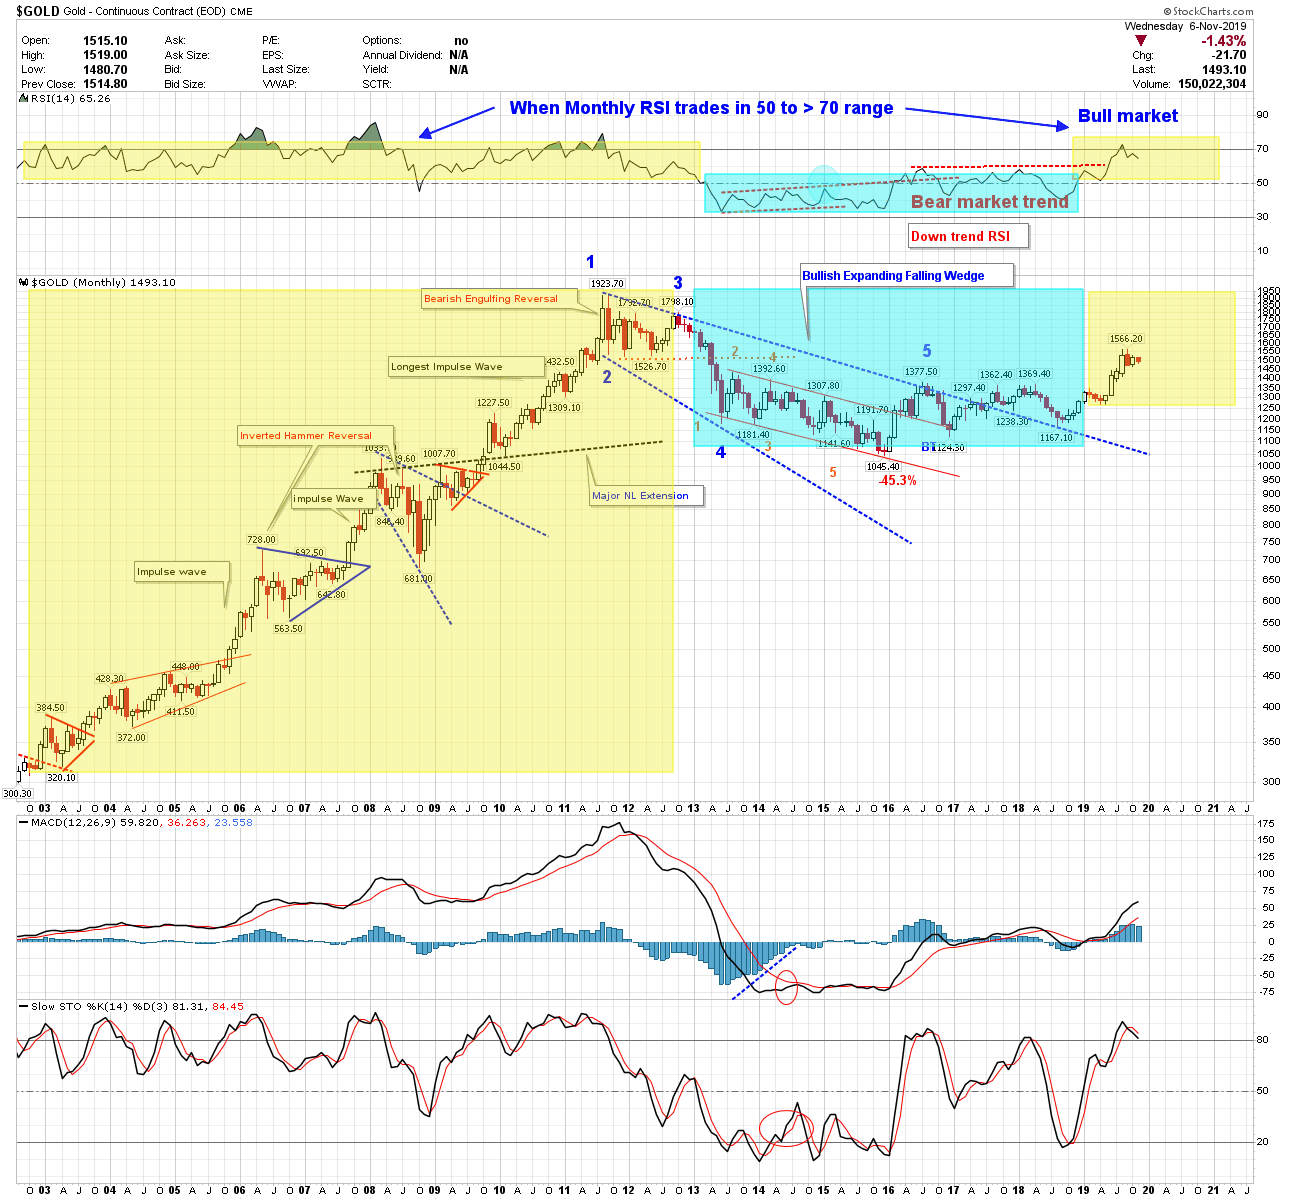
On monthly basis when RSI remains in the range of 50 to >70 over a longer period market is in uptrend.
On the contrary when RSI remains bin the range of 50 and < 30 for longer period market remains in downtrend.
Two charts are compared. Yellow boxes for uptrend and aqua box in downtrend.
Gold seems to have change the trend this year after breaking oit from long term downward leaning wedge.
SPX remains in uptrend till it is not.
Great Chart Sir Bikoo