Indicators, Indicators, Indicators
They can be very, very useful, BUT it’s really important to consider them on all time frames. I think we have a good example at the moment. Lets take a look at Williams %R (which is a momentum indicator). Looking on a short time frame it looks like this…
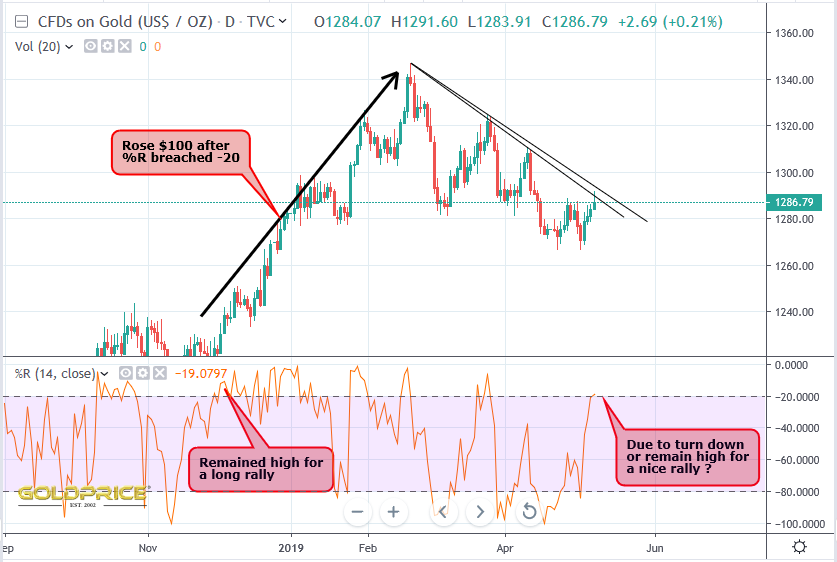
Looks to be getting high, so it may turn down at any time, suggesting there may not be enough momentum to carry price through resistance. However, if you look back at late 2018, you can see it remained high for weeks as gold rallied another $100. In order to help decide whether this is likely, it’s useful to zoom out and consider the indicator on a longer timeframe. Here it is on the 5 year view…
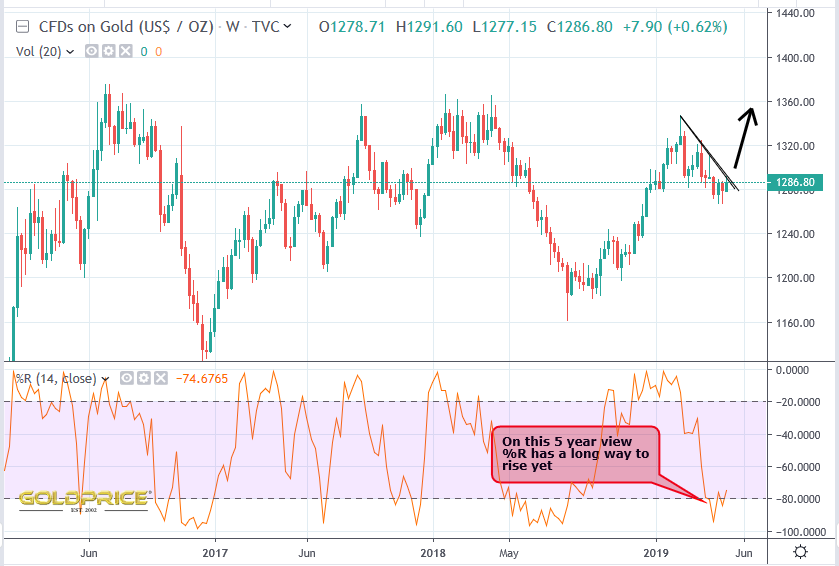
Conclusion – we’re just getting started. Downside looks limited (still $1220-$1240), whilst upside is considerable. Personally, I doubt we drop much further from here, but It’s worth bearing in mind until we close the week above the wedge.
EDIT – I should add that I selected the 5 year view and zoomed in a bit, to show the last 3 years or so.