More Lessons From The Past
The last great bull market move in gold really got going after a confirmed breakout in 2002. Gold went on to multiply by a factor of 6, moving from a little over $300 an ounce to a little over $1900 an ounce. Many miners saw their share prices rise by thousands of percent (the HUI rose by a factor of 10). It’s hard to imagine a repeat, after all, that would mean gold at nearly $10,000. I really don’t know if that’s remotely possible, but the charts will give us advance notice. That’s because we have a timeline – we know when the peaks and troughs of the gold cycle are due, so if we are already near the old highs, with years of bull market to go, we can plan accordingly. Anyway, I digress. First things first – we need that confirmed breakout at around $1355, then $1400 to be certain. How did it look back in 2002, versus today ?
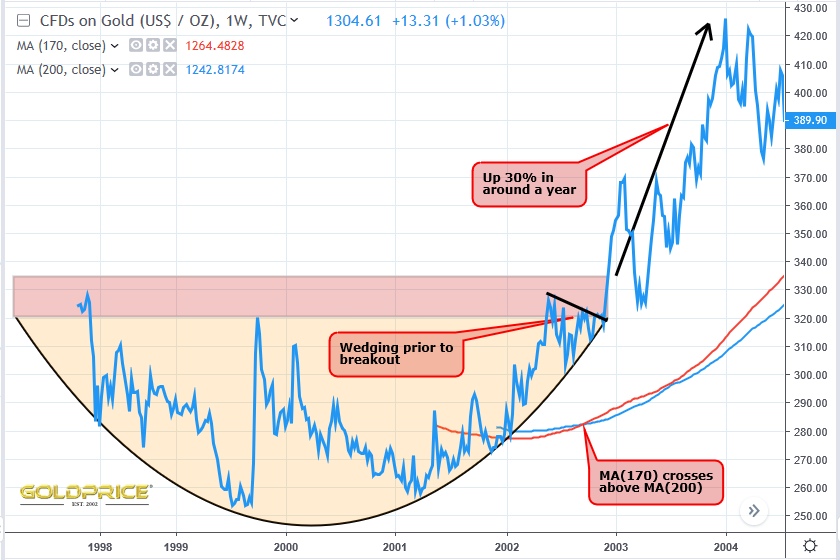
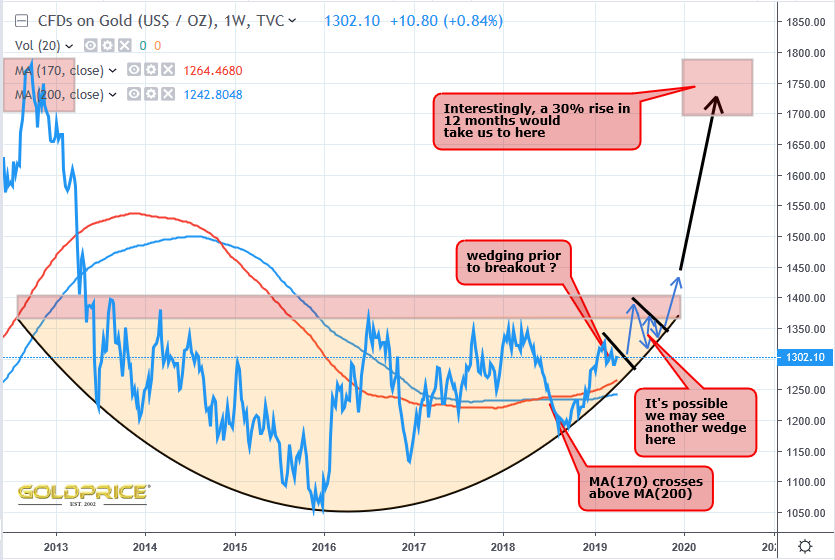
I don’t know about you, but I’m really liking the way this looks. As always – watch that curved, base support. It needs to hold.
Thanks Your charts are amazing. Yes HUI out performed SPX by multiple factor in 2000 to 2008.
After 10 years will it repeat again???
Thanks Bikoo. We’ll have a good indication that it might if/when we get a convincing breakout above $1400. The time it takes to reach $1700-$1800 region will be very telling.
Thank you NS. Lovely chart. When you say that the curved base support needs to hold does that mean that we can’t go below $1300 again?
Cheers CT. That curved base is currently around $1260, so we don’t want a close below that. If that were to happen, this ’rounded base’ would be invalid, and we’d be looking at that ‘red hot’ support line in my earlier post for final support. A break below that would end any hope of a gold bull anytime soon.
Oh sorry. I wasn’t looking carefully enough. I mistook your arrows for lines. Thanks.
No problem 🙂
I haven’t the slightest idea why anyone thinks the dollar will go down. Until that happens, gold is going sideways for a couple of years.
I agree the Dollar may have a little life in it yet, but I disagree on the 2 year timeframe. I would put it at no more than 6 to 9 months.
Superb charts Northstar!! Any particular reason you can share for using the 170ma in your crossovers? The 200ma shows up as a default moving average for many charting programs, but this is the first time I’m seeing use of the 170.
Great question Triplehstocks, I was waiting for someone to ask that. It’s often worth playing around with the parameters for the indicators. I was looking to adjust them to find the point in the past that corresponded to the breakout. I put the 200 MA on, then added the 50 MA and adjusted it up past 100, then 150, and eventually up to the 170 region which gave the signal close to the breakout back in 2002, I then applied those same moving averages to the present day to see what I got, and hey presto – a very similar signal, with the bullish crossover having occurred recently. Sometimes you have to search a bit harder when you’re looking to find indicators that trigger the appropriate advance signals. I always try to look back into the past for confirmation that they work, especially in comparable set ups, in terms of cyclical timing.