Bullish Wedge ? I Hope So !
You might remember a little while ago, I put up a chart which highlighted what I thought would be an extremely bullish sign/pattern. It looks like it might be in play now, and it’s going to get the bears excited. I think my original target in the $1240 area is still on. As time has gone by, the support has increased closer to $1250. My chart below shows the rounded base giving support around $1250 and that black resistance line forming. A wedge causing price to coil below such a hugely important area of overhead resistance is very, very bullish BUT that support has to hold. Two lines in the sand – $1250 and $1365 (although I won’t breathe easy until we break the psychologically important $1400 barrier)., That’s it. That’s all that matters now.
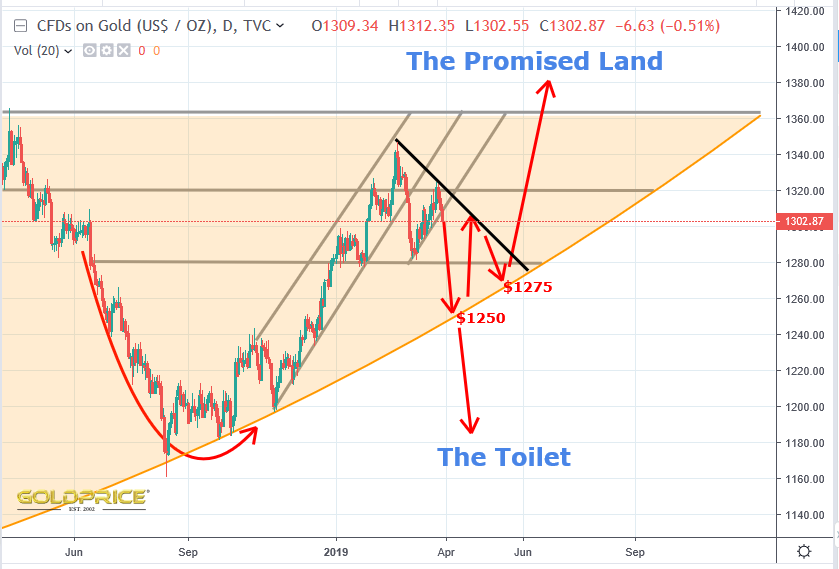
My opinion is that if we are in a gold bull that price shouldn’t fall below the previous ICL of $1280.80 which occurred during the week of 4 March. For that reason, I don’t think we’ll see the $1250 scenario.
(Disclaimer: The above would require free currency and gold markets.)
http://schrts.co/axQfSBqZ
Fully agree, NEM is green today, and GDX not so weak. Downside GDX limited to 22 level I guess
While it looks to me like the ICL is in, I should probably add that it’s possible gold’s ICL wasn’t during the week of Mar. 4 and it’s still finding it’s ICL as we speak. (I think cycles are very helpful but they’re subject to interpretation, and unfortunately, like many things, are most clear after the fact!) If the ICL isn’t in yet, 1280 is meaningless.
Northstar – exactly, with a good “mini-battle” on the way down at 1,280 (as Curly Top points out the previous ICL)
IMHO miners will resist a big drop until 1,280 goes – then a quick wash-out down and reversal
Keeping those lines in the sand in mind.
Corporal Jonesy?, Dad’s Army – “Don’t Panic”… SuperCut
https://www.youtube.com/watch?v=nR0lOtdvqyg
It’s been a long time coming, and it’ll sort the men from the boys. I can see the $1280 level as a possible termination point, but the base of that bowl is also a possibility if we get some sort of ‘spike low’.
Maybe this builds out the handle for the cup built out since last summer? To be honest, not sure bears have much ammo left to pull gold lower … time will tell, but I am still a firm (and patient) believer gold/silver have many good days ahead of them.
If today’s Gold price is confirmed on the chart then the Bear flag just got triggered, with an expected price move down to about 1255.
Sid Nelson’s Elliot Wave/Hurst Cycle analysis shows gold hitting $1240-ish by this summer, then moving higher. He has silver hitting $14.75-ish earlier than gold, then moving higher … $26/oz by the end of 2020. I think the $USD has its last run up leading into the summer, then it moves lower.
Could be, but I have seen different Hurst analysis over the years that have different outcomes. Watching this video explains some differences are due to the kind of analysis used (through or peak) This author sees either low April/Mayr and strong rally or low in August.
https://www.youtube.com/watch?v=qwN7XHgTI9Q
Do you have any gold chart of that author?
Not sure I can share it here? If you provide me your e-mail I’ll send it so you can check it out. I think his main analysis is Elliot Wave.
millaralex at aol.com
Thx