The End of Gold’s Seven Month Rally
Gold bottomed in mid August 2018 so its current rally is now 7 months long. I think price will rise a little further from here, then the rally is done.
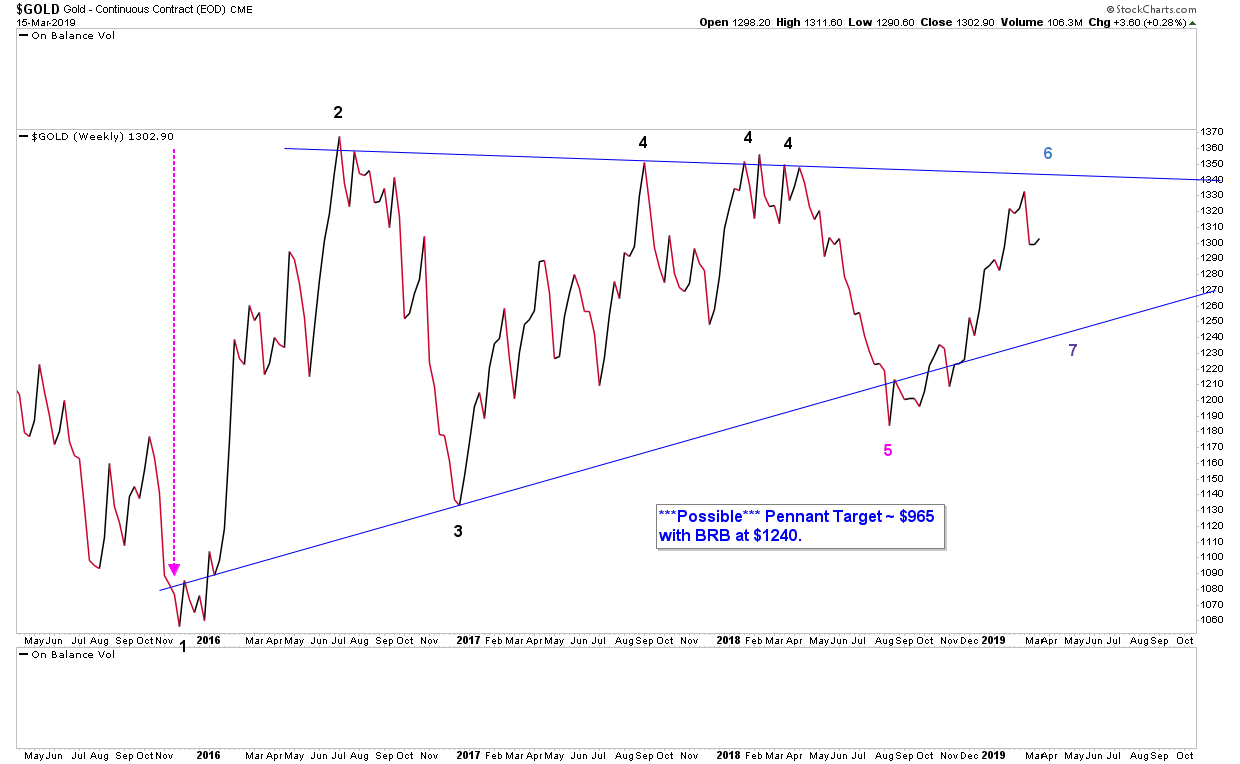
The above chart shows price is yet to clearly test the top rail (point 6), and would need to rally up to $1340 – $1350 to do so.
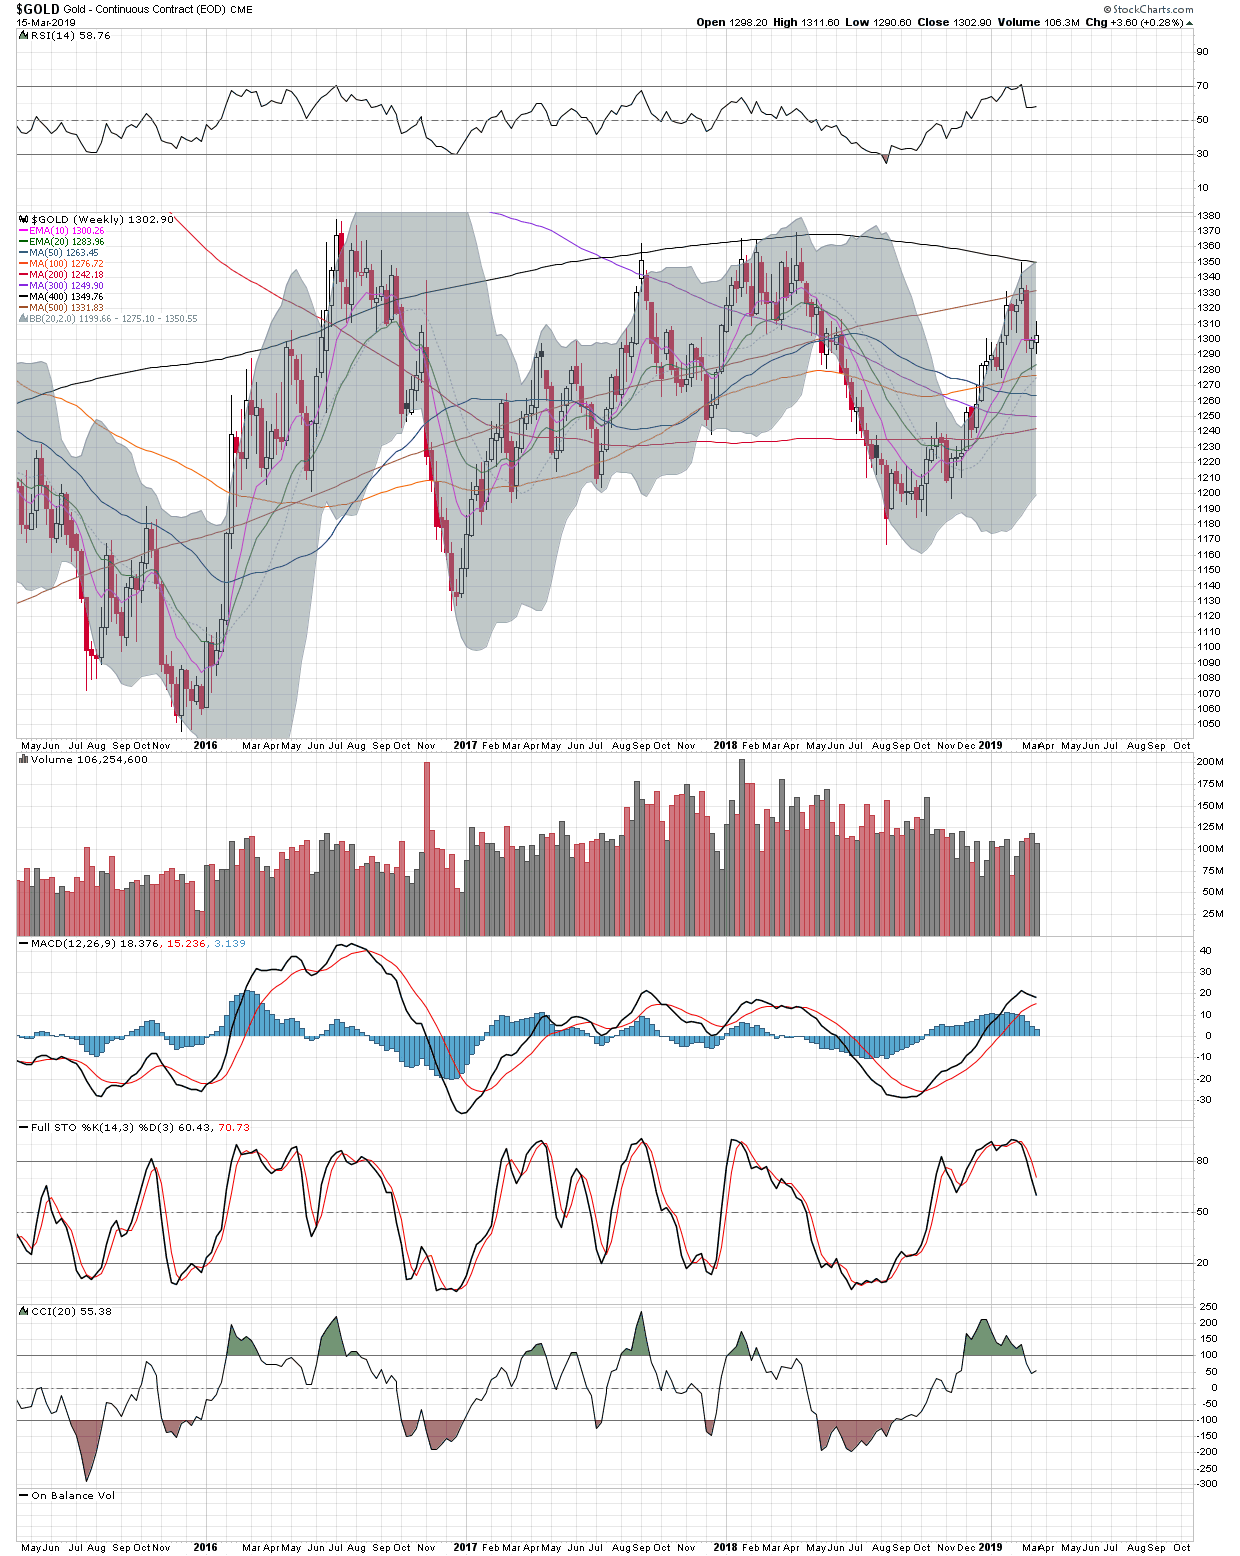
The above chart shows the weekly indicators (RSI, MACD, MACD Histogram, STO, CCI) are already rolling over.
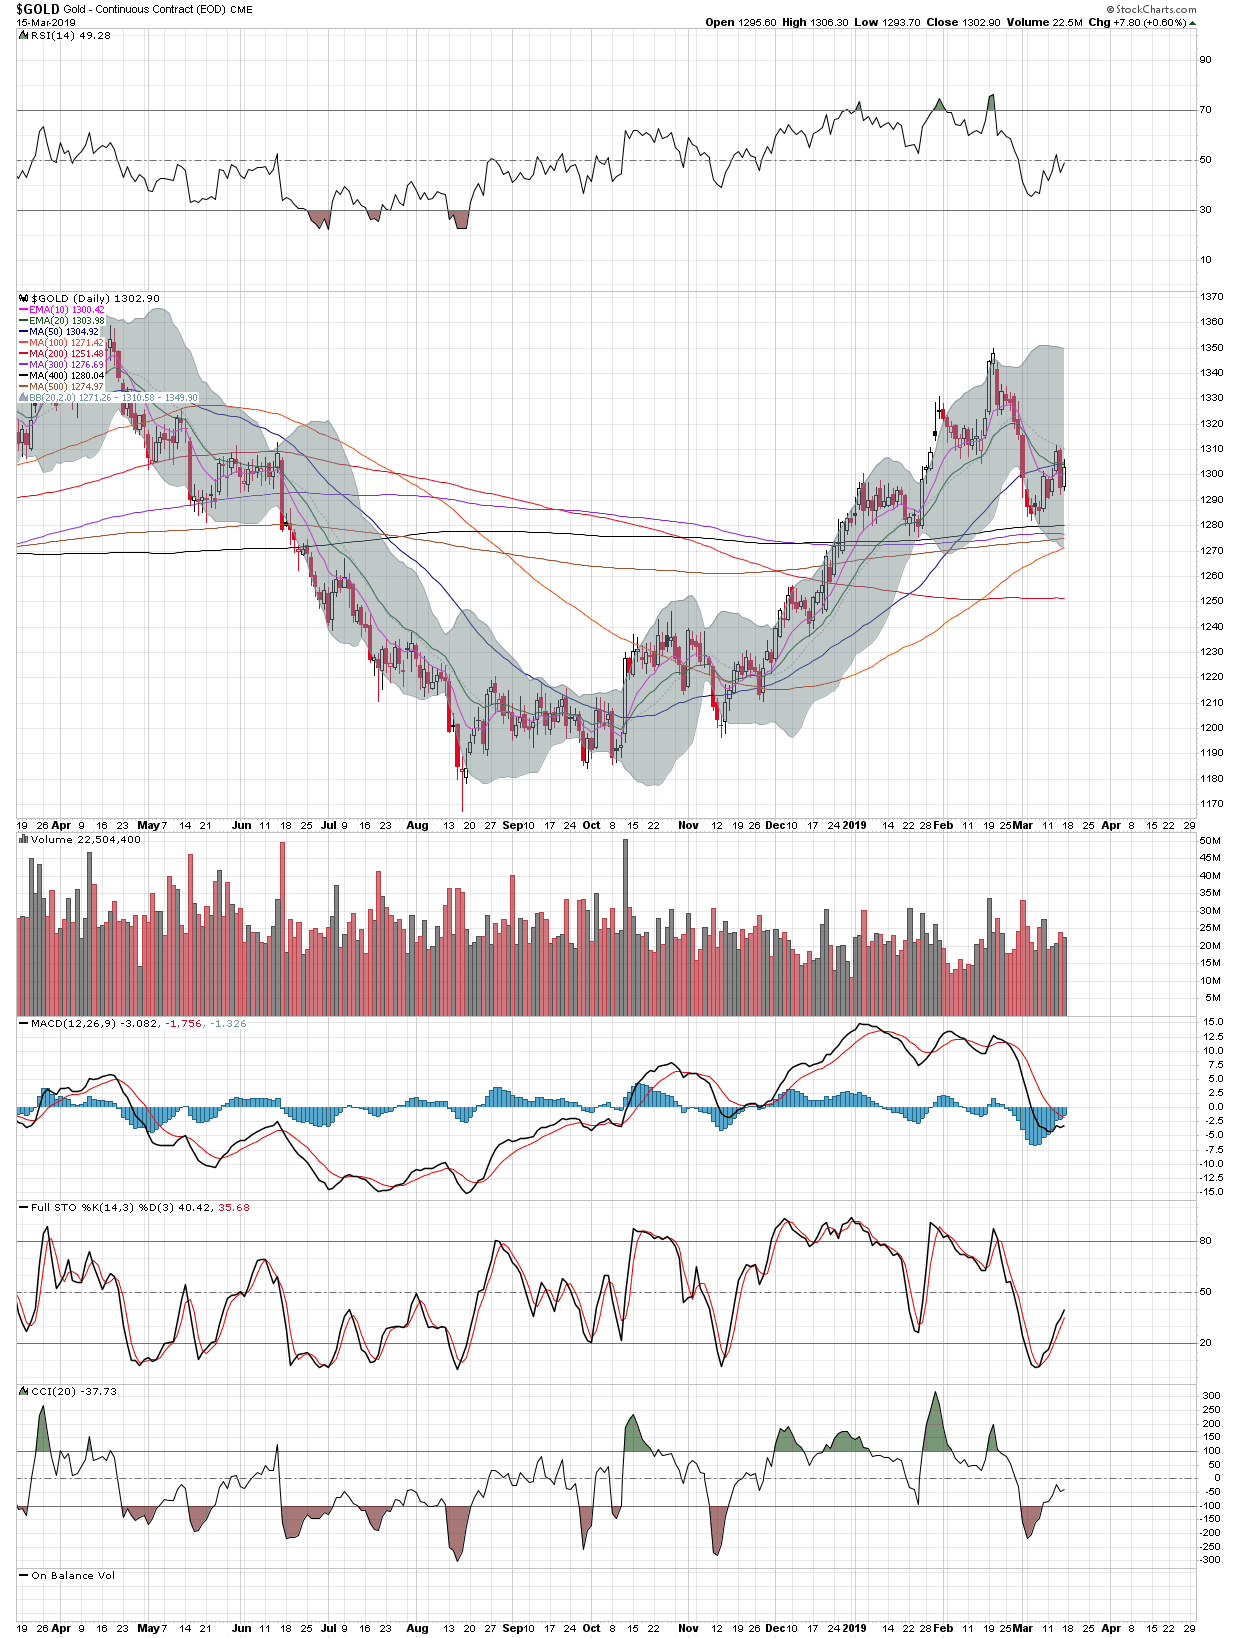
On a shorter term basis, the daily chart shows the indicators (MACD, MACD Histogram, STO, CCI), are primed for another little rally.
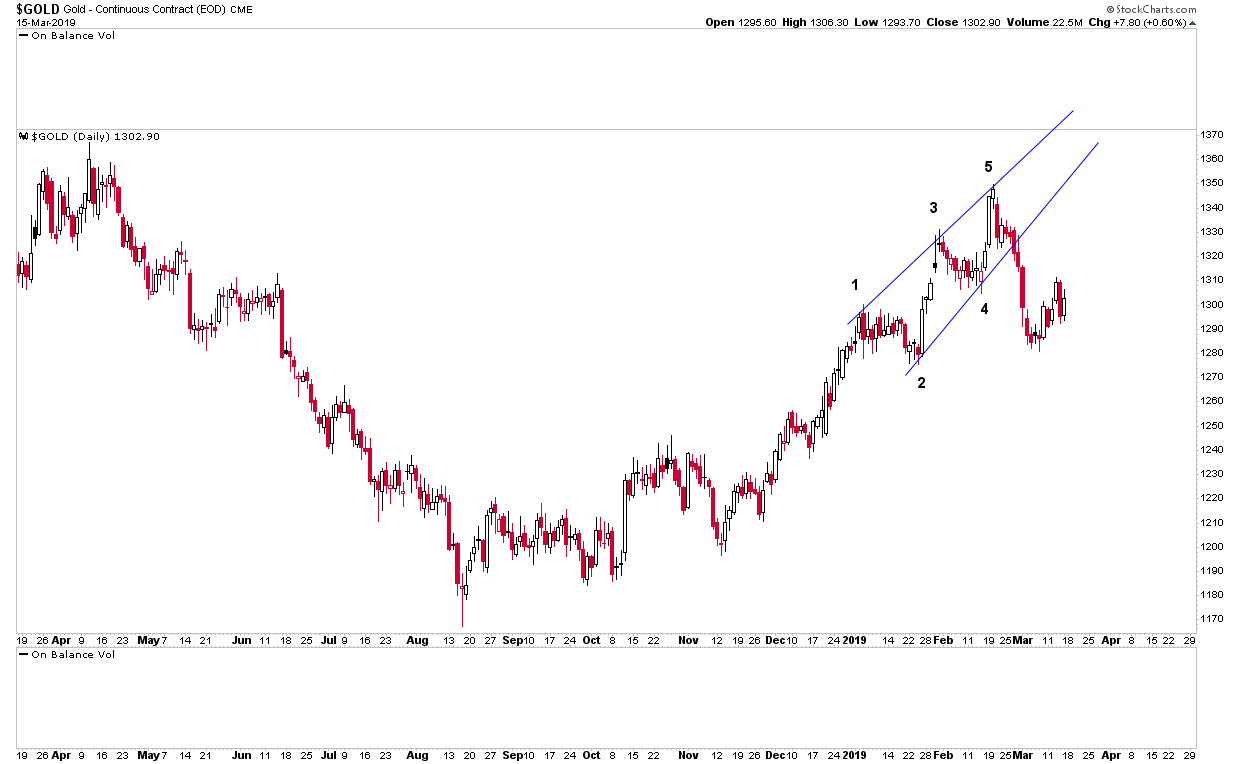
Finally, the above chart shows that price can rally back up to $1340-$1360 on an intraday basis, yet all it would be is a backtest of the bottom rail of the
already broken rising wedge.
Very different to my analysis, but it’s great to see all sides of a discussion. Remember, if we are in a proper bull market, those indicators will easily turn back up snd stay high (just look at SPX, QQQ Dow Jones). As always, time will tell.
Agree about the indicators but they’re just one piece of a puzzle.
Let’s let the market decide!