Gold back testing bull market line? Around $1275 is crucial.
Three charts showing possible backtest of the bull market trend lower line (2015-2018). It’s difficult to get the exact point because the blue pitchfork doesn’t line up exactly with the orange line (though they are close) and the long term chart is going to be less precise. However, $1270+ is going to be important because it gives a possible backtest of an important previous breakout to the downside IMHO. Price is $1275 today and that is still within the range of possibility for a backtest point. These charts were made before Christmas but I could not get on to upload them. I put in a username/password with a typo and got locked out – actually that is annoying if you have done it only once:
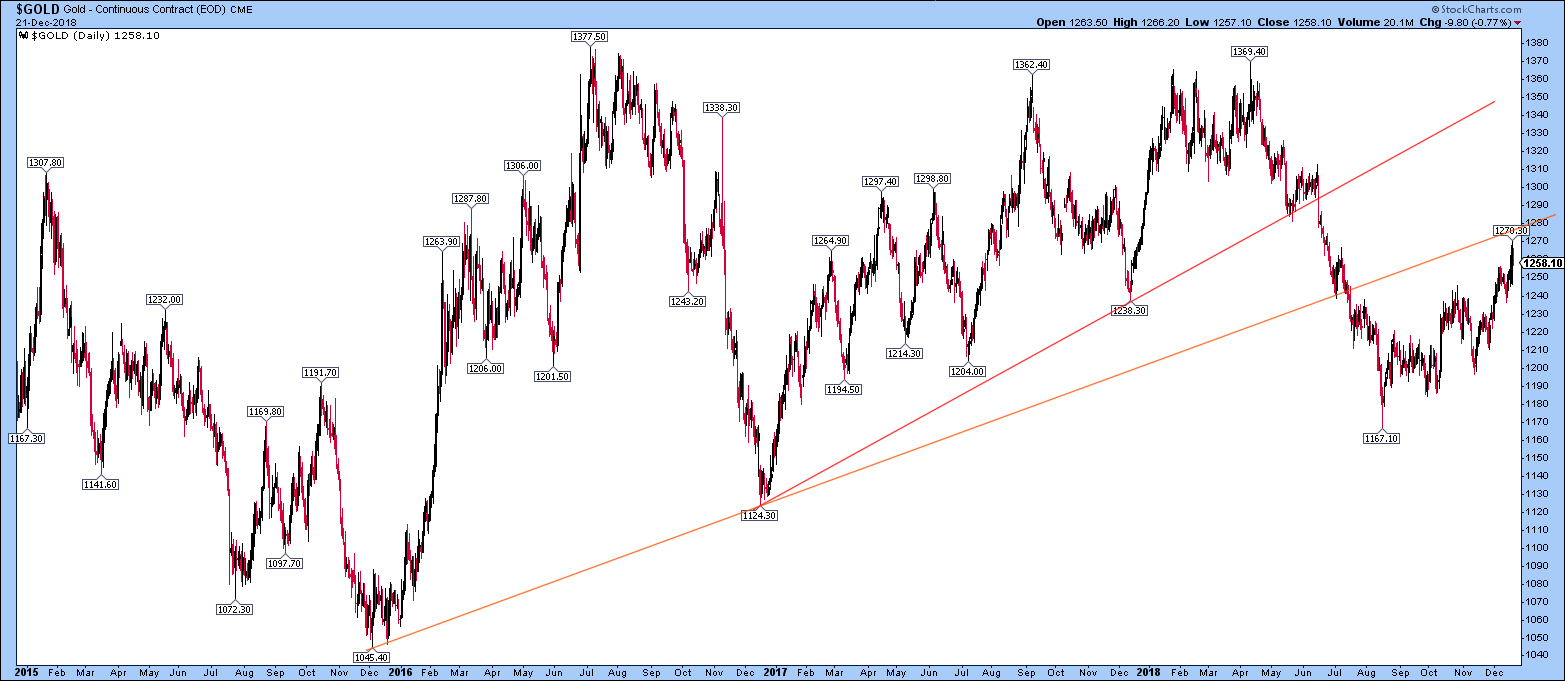
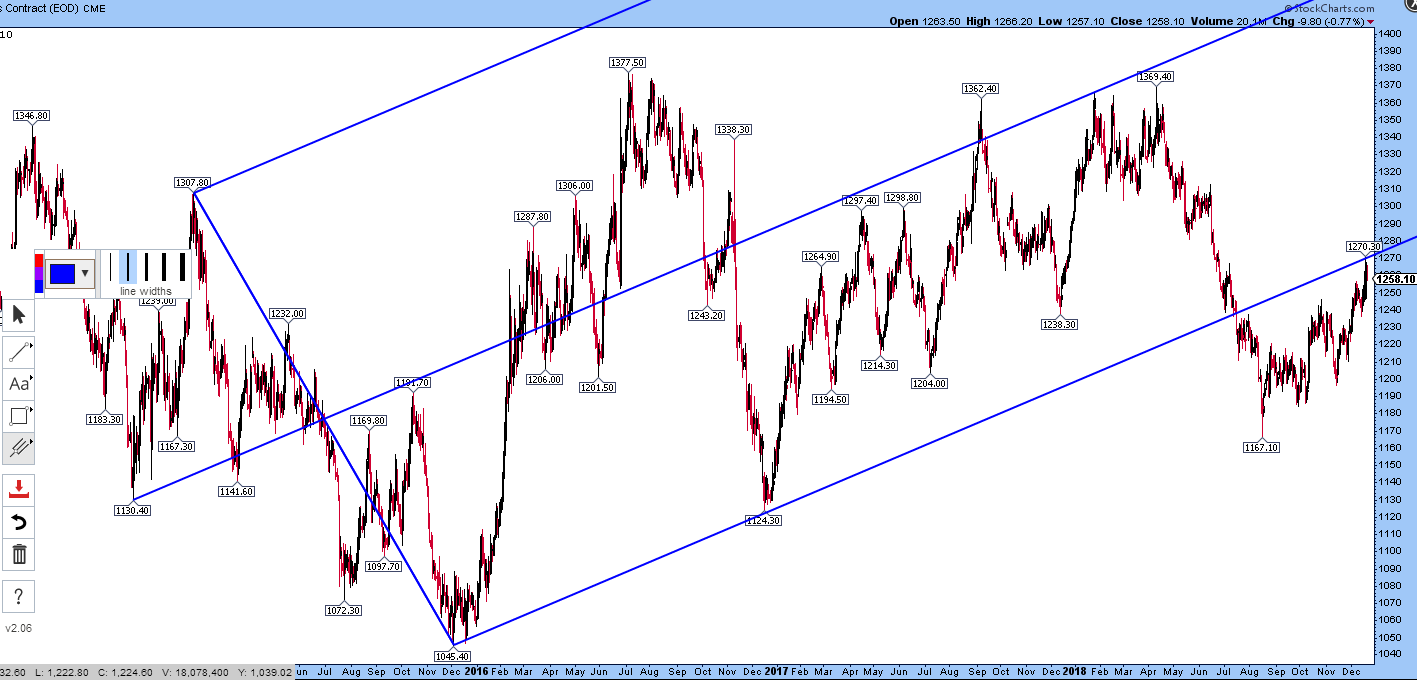
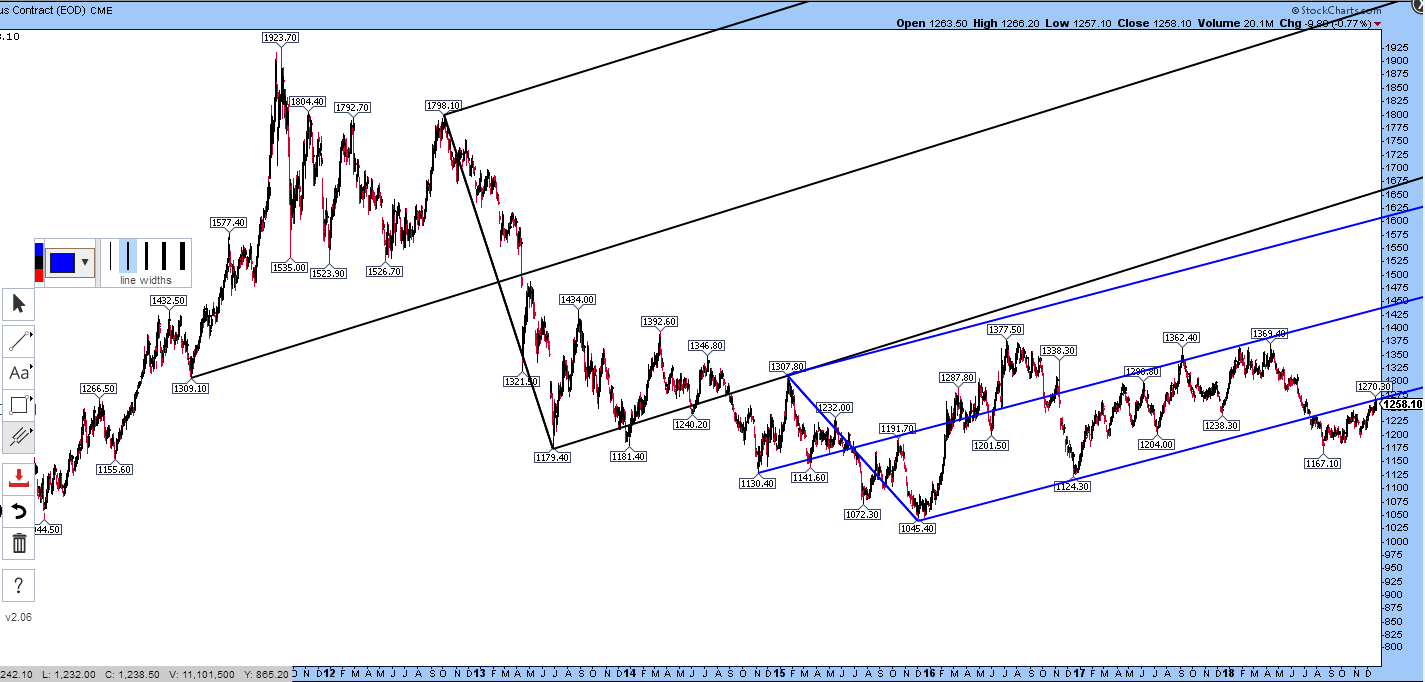
Bottom line: if this is a successful backtest of a downside breakout, then $1275 is about all you are going to get to the upside and it’s down from here on. If there is a re-entry into the former trend channels then whoopee!
Update 28 Dec 2018: Since Christmas Day, the range for gold has been about $1264 to $1281 with substantial time spent over $1275 so it’s pushing, pushing, pushing to get convincingly over that line. Time will tell.
Update 29 Dec 2018: Friday’s weekly close was over $1280. That looks nice for a possibility of a longer term re-entry into the fork but don’t hold our breath, eh?
Nice charts and comments today DaveintheUK
A lockout only lasts 30 minutes by the way.But yes its a pain
A Function of tight security
Tight security I’m happy with, as long is isn’t “security” from the guvernmint!