Dollar – Compliments of Rambus
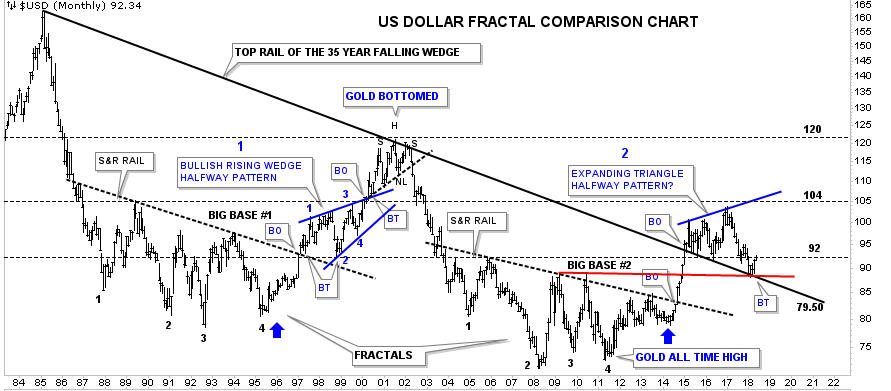
I added a simple support line going back to the previous highs in 2008 and 2010. Interesting how it intersects with the long term declining support line going back to 1985. Charts are such fun!
I added a simple support line going back to the previous highs in 2008 and 2010. Interesting how it intersects with the long term declining support line going back to 1985. Charts are such fun!
Looks like a big head and shoulder pattern from 87 to present
That would make sense if that was after a huge rise going back 30 years before 87. A major top formation only really happens at a major top.
Good chart. Thanks.
Thanks. That’s one of several ways of looking at the dollar chart. Time will tell which is right.