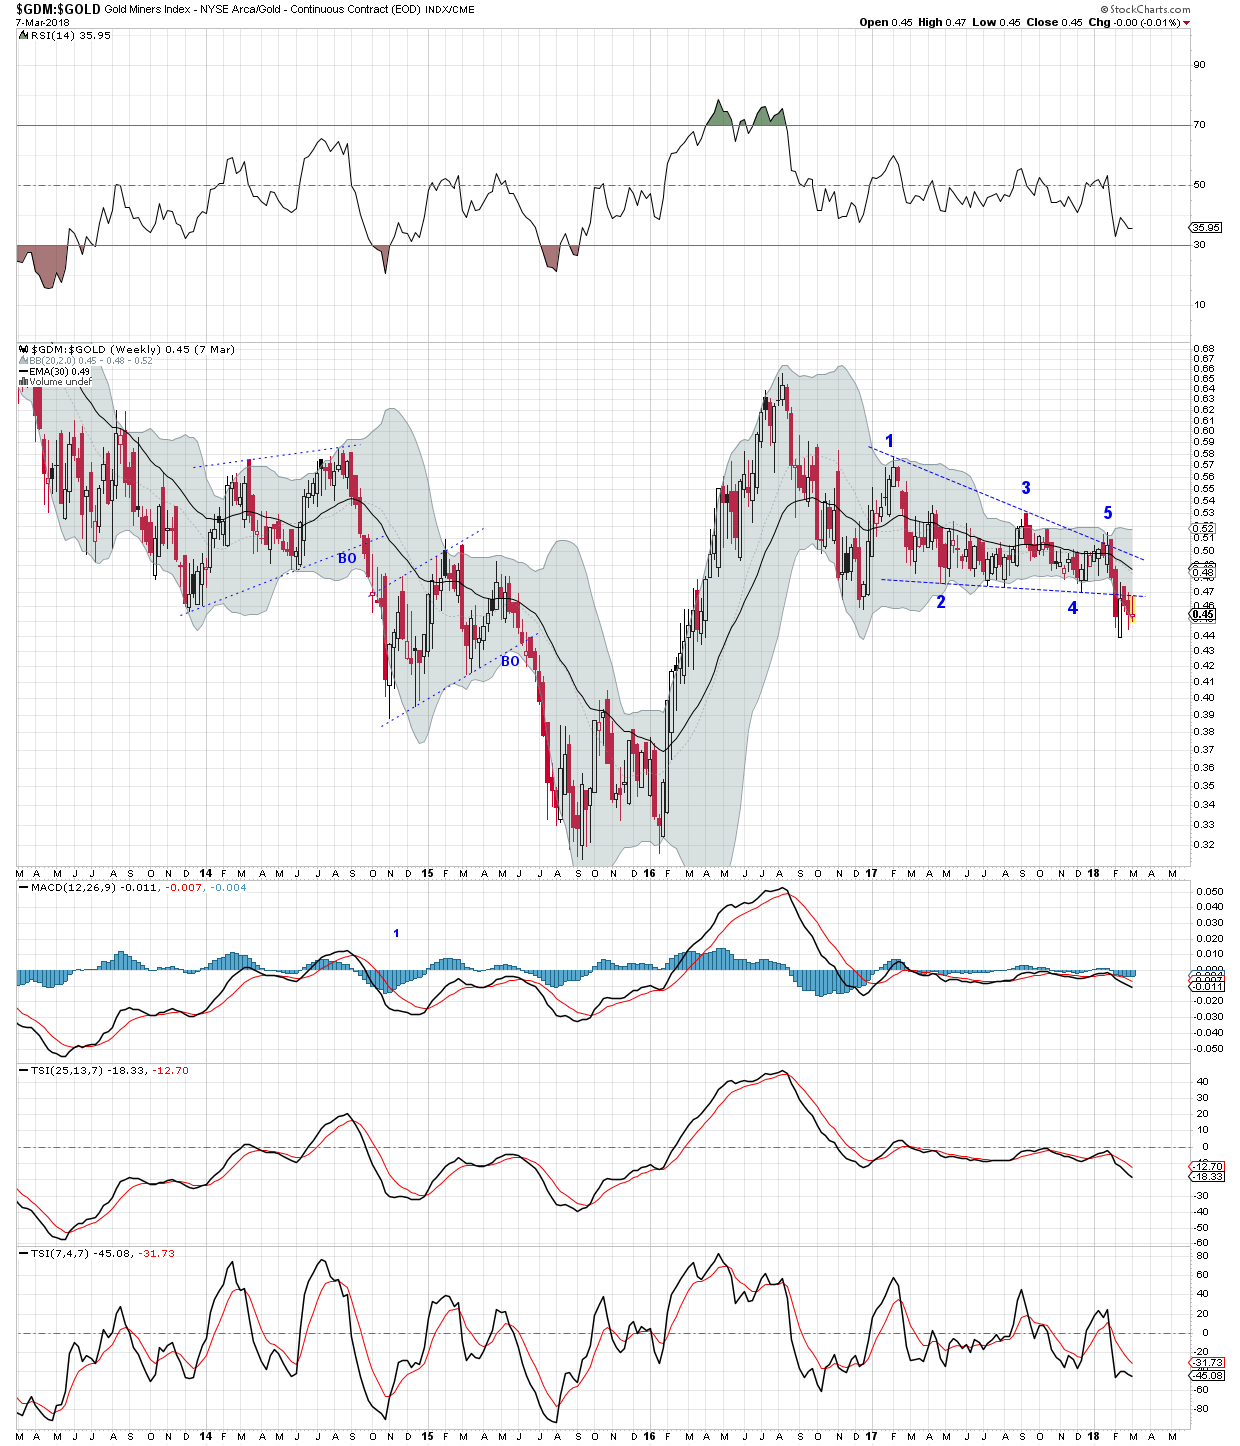
$GDM:$GOLD – Weekly
Where are the miners going in relation to the price of the metals?
Bull, or bear?
EDIT
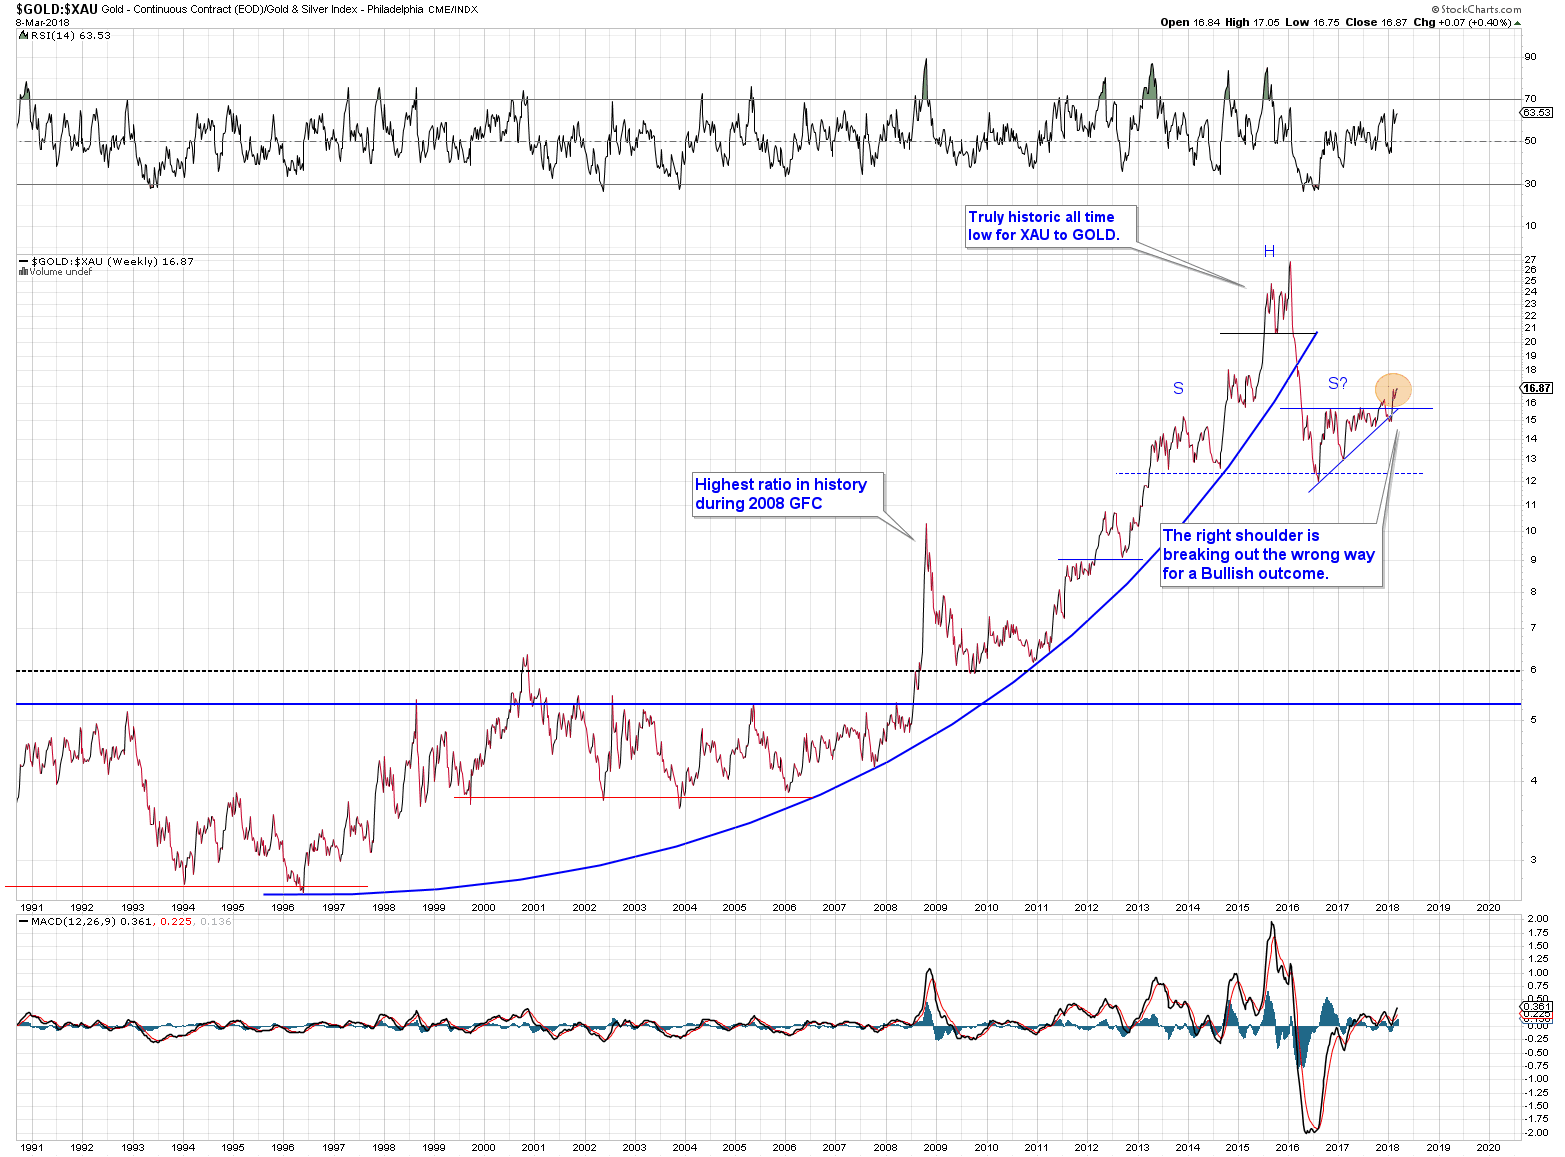
Here is one more example – $GOLD:$XAU. Notice this chart is set up the reverse of the $GDM:$GOLD chart, so the ratio rises as the miners gets weaker. Its an old Rambus chart from a few years ago – I hope he won’t mind if I post it here. This goldophile was expecting the right shoulder to break down. It didn’t happen, at least not yet. The break upwards of the right shoulder suggests the ratio could test the 21 level. It could be a false break upwards, but is it?
This is a very long term chart. Notice the gold stocks were more than 5 times higher in relation to the price of gold in 1996. What’s wrong with the miners?
Nice. Didn’t beat you by much.
Does look scary for a bull. A bull needs to see a move back above and no follow through at all down on these ratio charts…
Great look Silverfox
Yes that ratio is misbehaving….it looked like a classic H and S
Yes Gold Stocks have sucked for a LOONG Time….