Gold to silver ratio GSR
watch this ratio. Attached chart from 1981 to 2010 explains how this ratio reliably forecasts the market.
All comments by Bob Hoyes. Not mine!!1
————————————————————————————-
The gold/silver ratio has been a reliable indicator of credit conditions. It declines during a boom and does its greatest service when it typically signals the credit contraction by increasing.
The key move in 2008 occurred with the turn up in May 2007 from 46. This was with the reversal in the credit markets and the technical break out at 54 in August 2007 anticipated the fall disaster.
The next rise with the next panic was to 96 in November 2008 and the ratio can decline for a few months as the financial markets recover in the first quarter.
With the break above 54 in 2007 target on the full contraction became around 100. That level for the ratio was reached with the banking crisis that ended in late 1990, when the last of the 1980 adventures in crude, gold, silver and real estate were finally written off.

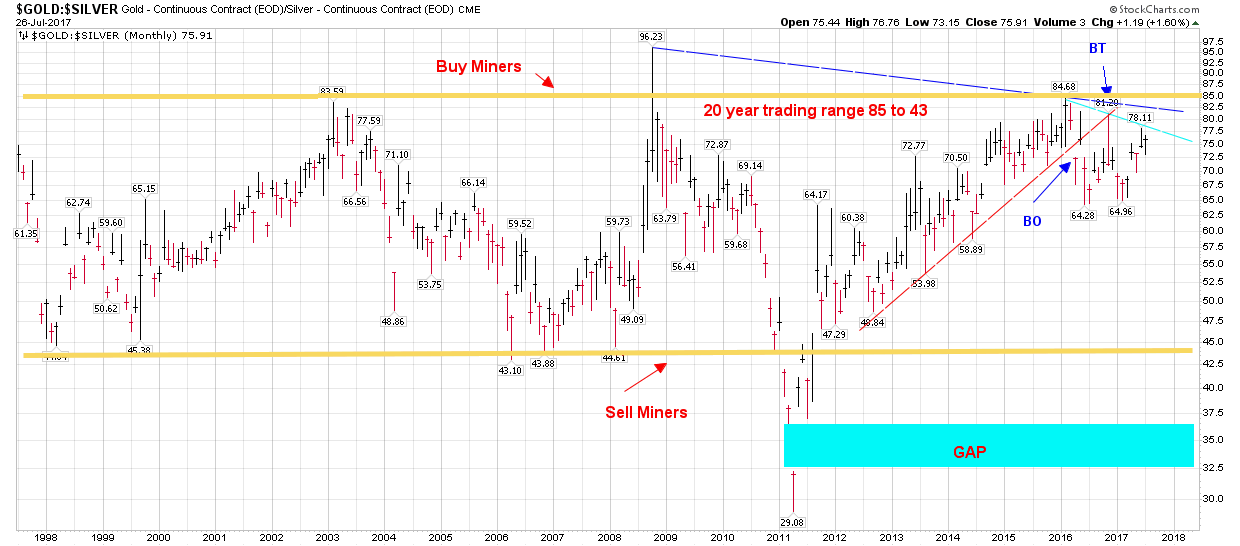
Current monthly chart:
Thanks Bikoo very interesting
I am not sure how good that chart is for trading. look at that sell signal for miners at the beginning of 2003.
2003 saw a very strong rally 2004 was a good time to sell.
Please explain what Bob Hoye feels about the current GSR ? Topping ? or is another Credit Crisis percolating
Thanks for this perspective
He has not be a good market timer. Currently he is thinking credit contraction and GSR going to 100 and market crash come this fall like in 2008.
We all know that is not the case.
I just follow his hypothesis only and use my charts .