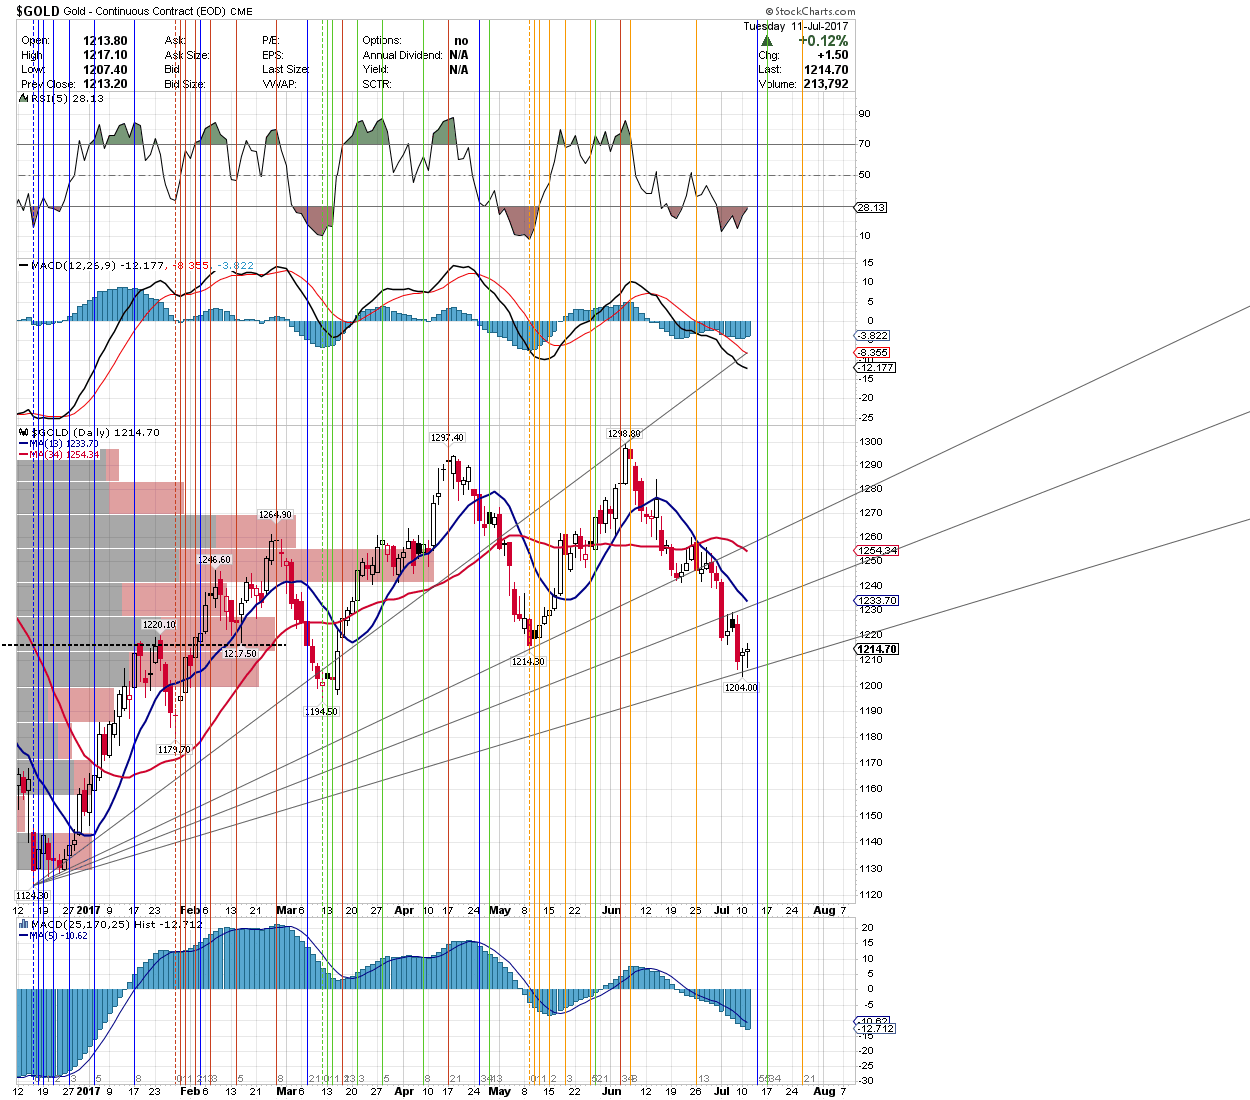
$Gold – Daily
Here is a gold chart for Fibonacci fans (pun intended!).
First, the fibonacci fan-lines, drawn from the December bottom to the June high. Gold appears to have found support right at the last line of defense – the 61.8% fan-line.
Next, note the vertical multi-colored fibonacci time zone lines, two of which (blue & green) have come together to indicate an eminent market turn. These different fibonacci-based cycles have accurately predicted most of the market turns since December within a matter of days, if not to the exact day.
Last, the interplay between the 13 & 34 day simple moving averages (MA). Note the solid resistance at the (blue) 13 day MA which has rejected price advances since mid-June, and the triple-whammy smack down of Gold on June 26th, where the 13 and 34 day MAs came together on day 13 of the (gold) fib cycle.
I get it!
I think you out fibbed Fibonacci himself.
🙂