OIL Monthly
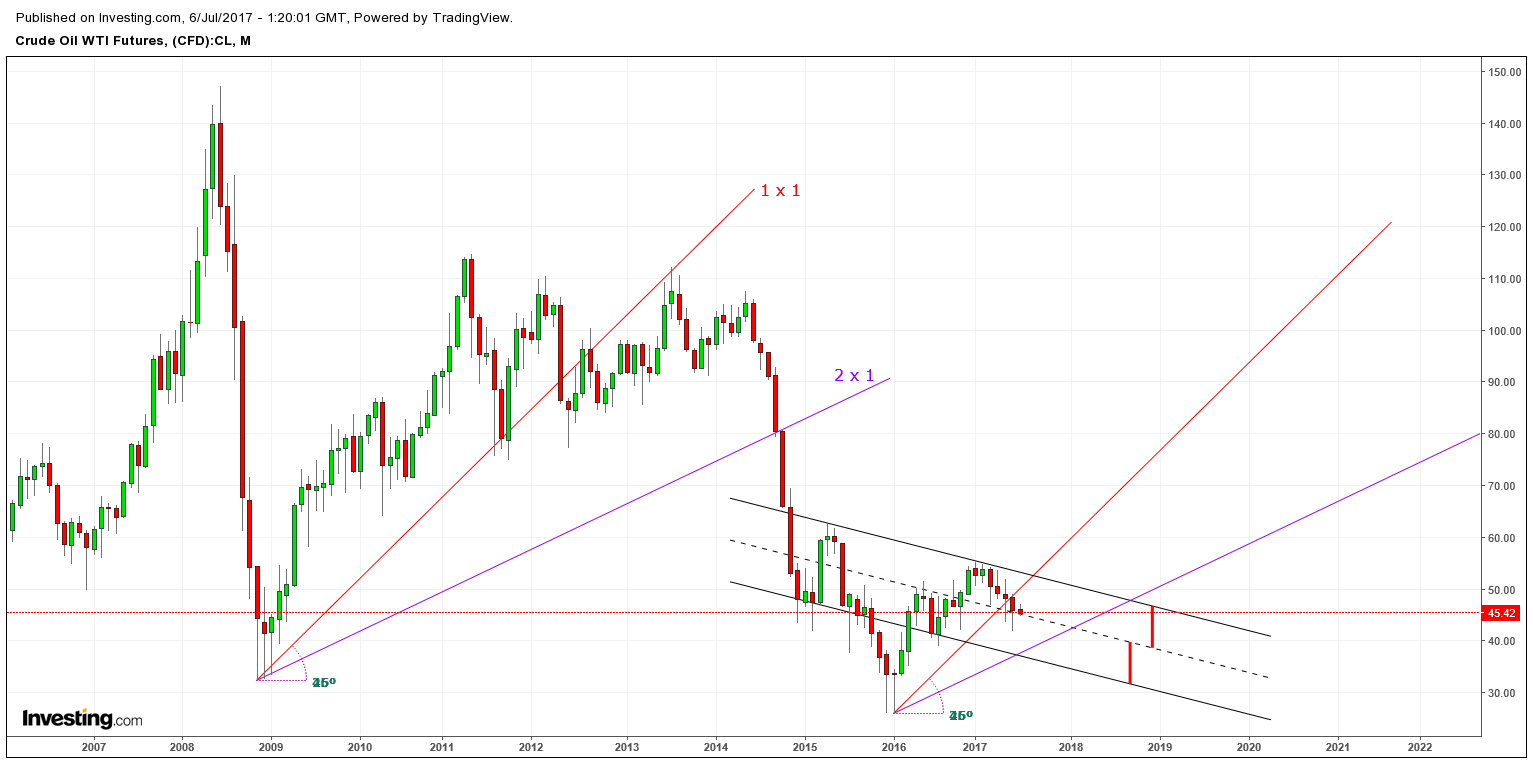
All of Gann’s techniques require that equal time and price intervals be used on the charts, so that a rise/run of 1 x 1 will always equal a 45 degree angle (1). He believed that the ideal balance between time and price exists when prices rise or fall at a 45 degree angle relative to the time axis. This is also called a 1 x 1 angle (i.e., prices rise on price unit for each time unit) (2).
In his book, Technical Analysis From A to Z, Steven Achelis explains the concept of Gann Angles as follows: “Gann Angles are drawn between a significant bottom and top (or vice versa) at various angles. Deemed the most important by Gann, the 1 x 1 trend line signifies a bull market if prices are above the trend line or a bear market if below. Gann felt that a 1 x 1 trend line provides major support during an uptrend, and when the trend line is broken, it signifies a major reversal in the trend
“Gann observed that each of the angles can provide support and resistance depending on the trend. For example, during an uptrend the 1 x 1 angle tends to provide major support. A major reversal is signified when prices fall below the 1 x 1 angled trend line. According to Gann, prices should then be expected to fall to the next trend line (i.e., the 2 x 1 angle). In other words, as one angle is penetrated, expect prices to move and consolidate at the next angle.”(
It is convention that once a Gann angle “touches” price then that angle is discontinued.
Adopting that method and adjusting the angles you can effectively determine the “formulae” of the chart and then those angles can be used going forward from significant highs and lows to determine turn points.
Thanks for your input Norvast, very much appreciated. I am not quite understanding what you are implying, in the example above the 45 degree trend off of the 2008 bottom interacted with price 4 times (support, break of support & 2 back tests), if the angle is discontinued after the first interaction then how would one know where price is in its momentum cycle? The 45 is a very good place to go short on a back test, not just once but the second time also as the chart shows. I supplied a link of the DJIA, also 2 Gann angles that have shown relevance in its price ascension, touching many times still showing relevance. If you could include an example if you have time it would be appreciated, knowledge is power.
https://invst.ly/4b5m1