Reasons To Be Optimistic
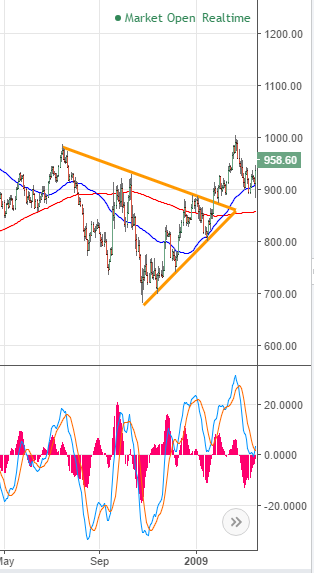
Very interesting to see the mood in the tent right now. Some are looking up, but, I think, many more are looking down. I’m trying not to be an eternal optimist, and I certainly do take all the bearish views on board. Having said that, I do find Graddhys work on the dollar compelling, and the fundamentals (to me at least), do seem to support a rising gold price (negative real rates especially). You could look at the following HUI chart and be very concerned…

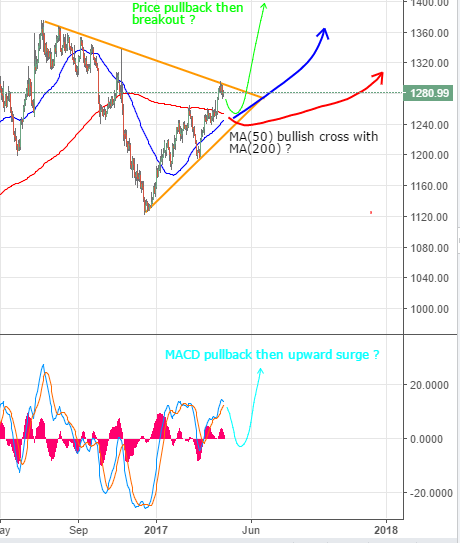
If you ‘zoom out’ a bit though, things look a lot less concerning…
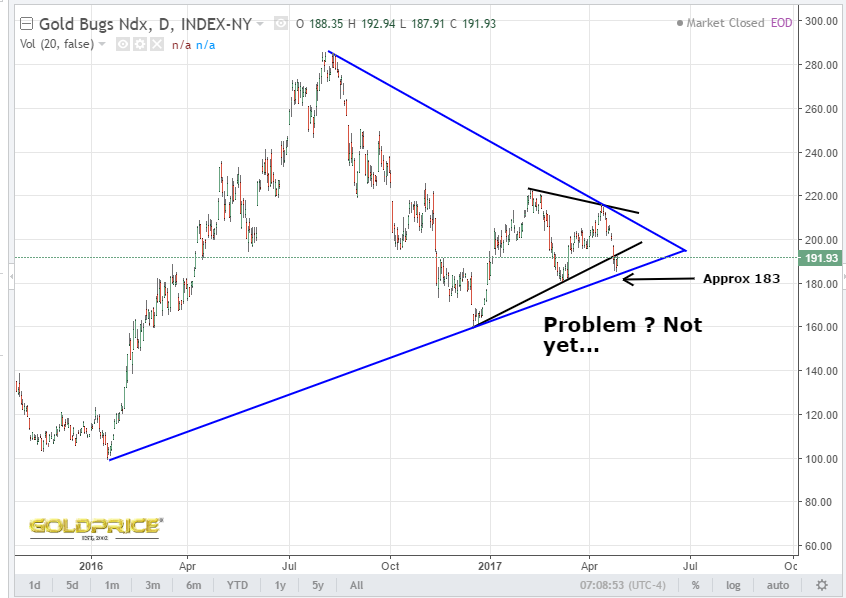
If we fail at the 183 area, I would turn bearish in a heartbeat. If not, it’s super-bullish. The equivalent chart for gold shows that it’s smaller triangle hasn’t broken to the downside yet, and it’s larger triangle has support at around $1150.
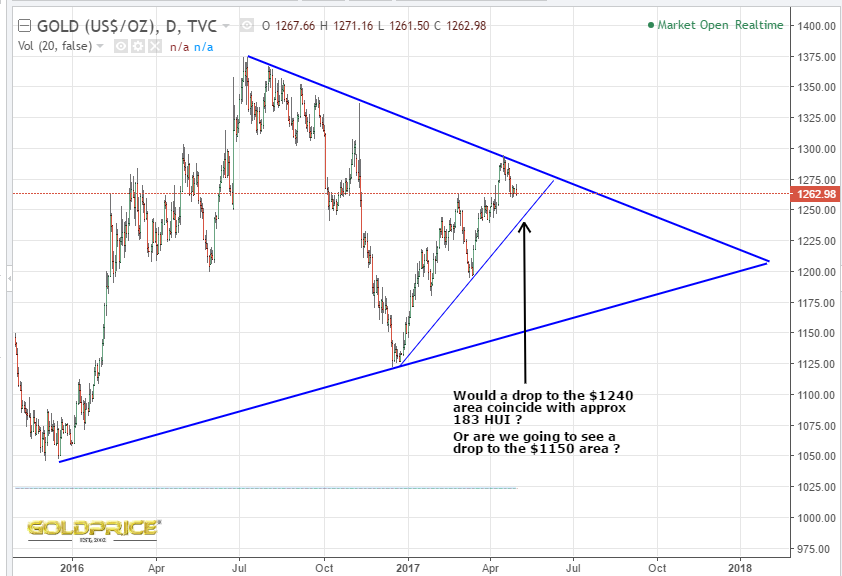
So how’s this for a possible scenario – gold drops to the $1240 area taking it to it’s support level. In the process, HUI drops to the 183 area, taking it to major support. That really would be the point at which we find out if this has all been a mirage, or whether we truly are in a new PM bull. That time is fast approaching.
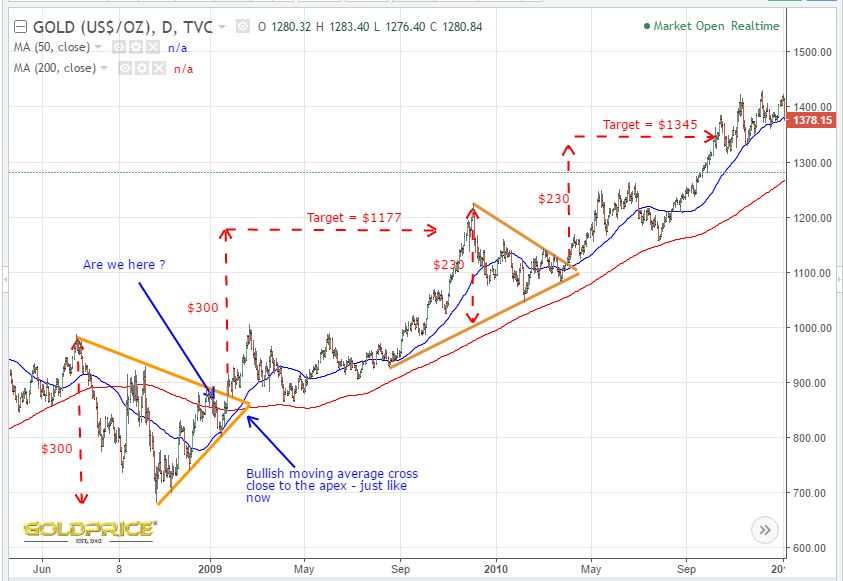
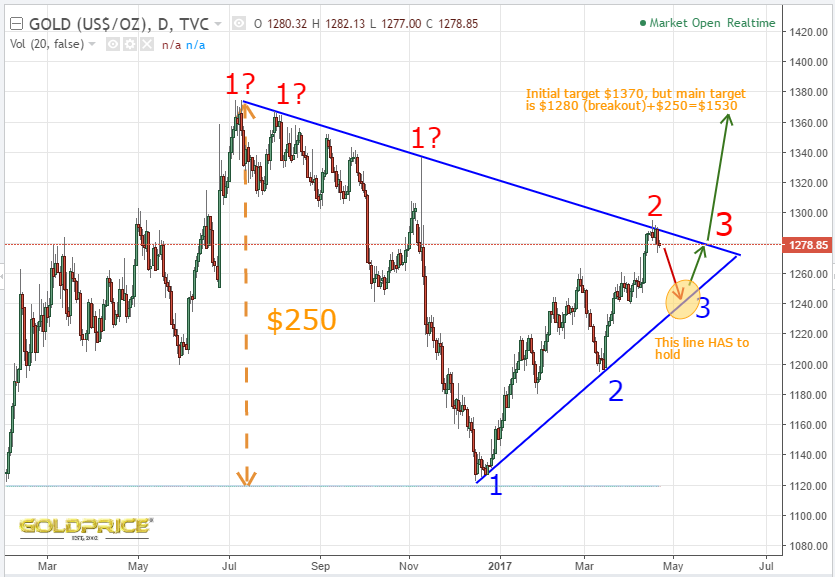
Finally (and apologies, but I can’t remember who to credit for posting the first chart previously), these are partly what’s behind my optimism.
1) Cycles – The bottom of the ‘red’ cycle marks the beginning of a new upleg. The bottom of the ‘green’ cycle marks a top. Both are indicating a new upleg getting underway.

2) Similarities to 2008 – here I’ve pulled together some charts from my recent posts.
Excellent Northstar. I like those cycles !
Northstar, I believe it all comes down to where we are in terms of EW labeling.
I Noticed Avi Gilburt sees end of Wave II correction at Dec 2016 lows in GDX and sees current correction as part of Wave 2 correction in Wave III I believe. Others see big ABC correction since August 2016 and believe we just experienced the A of an ABC correction with new lows to follow in May/June. Although I do like your triangle hypothesis I believe the latter scenario has a likelyhood of playing out and we could see the December lows in GDX/Hui tested in the coming months.
Avi’s target 34 GDX which is where higher degree B of 2011 will complete right after current this small c of B is done then we go down to C in a running flat, IMHO
And his timing for Aug fits into B of higher degree
Excellent work NS, and I am definitely in the optimistic camp. 🙂
http://stockcharts.com/school/doku.php?id=chart_school:chart_analysis:chart_patterns:symmetrical_triangle_continuation
Apply this to $, the top of the second triangle is over at 102 and by rule of alternation, $ should be consolidating whipping around wave4
Good charts, Northstar. Am watching things unfold here.
Very neat green red cycles. The guessing game goes on but right now a Macron win is priced in.
the sentiment is still a bit high but more time and consolidation would set up well for the optimism I share – thanks for the charts and excellent work NS
Sentiment far too optimistic on this forum, wait until we hit HUI 180 and Hui 160, with gold it is always the same, buy when everybody is scared and sees $1000 gold again. I prefer to wait another 4 to 6 weeks.