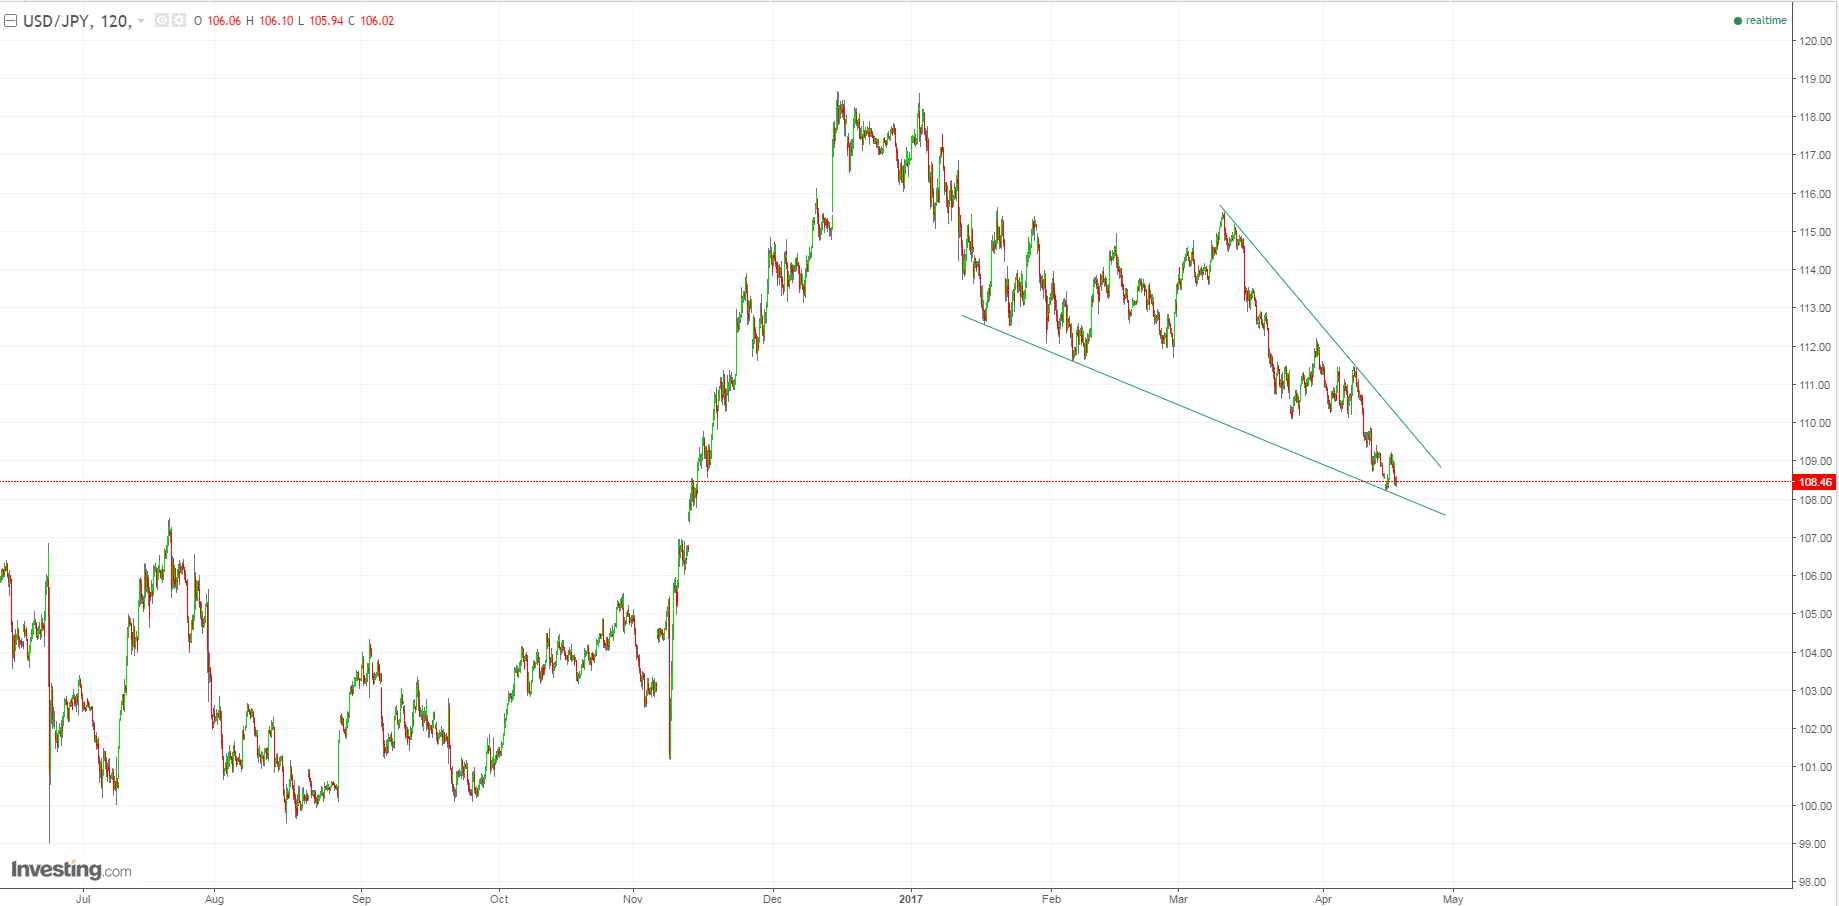
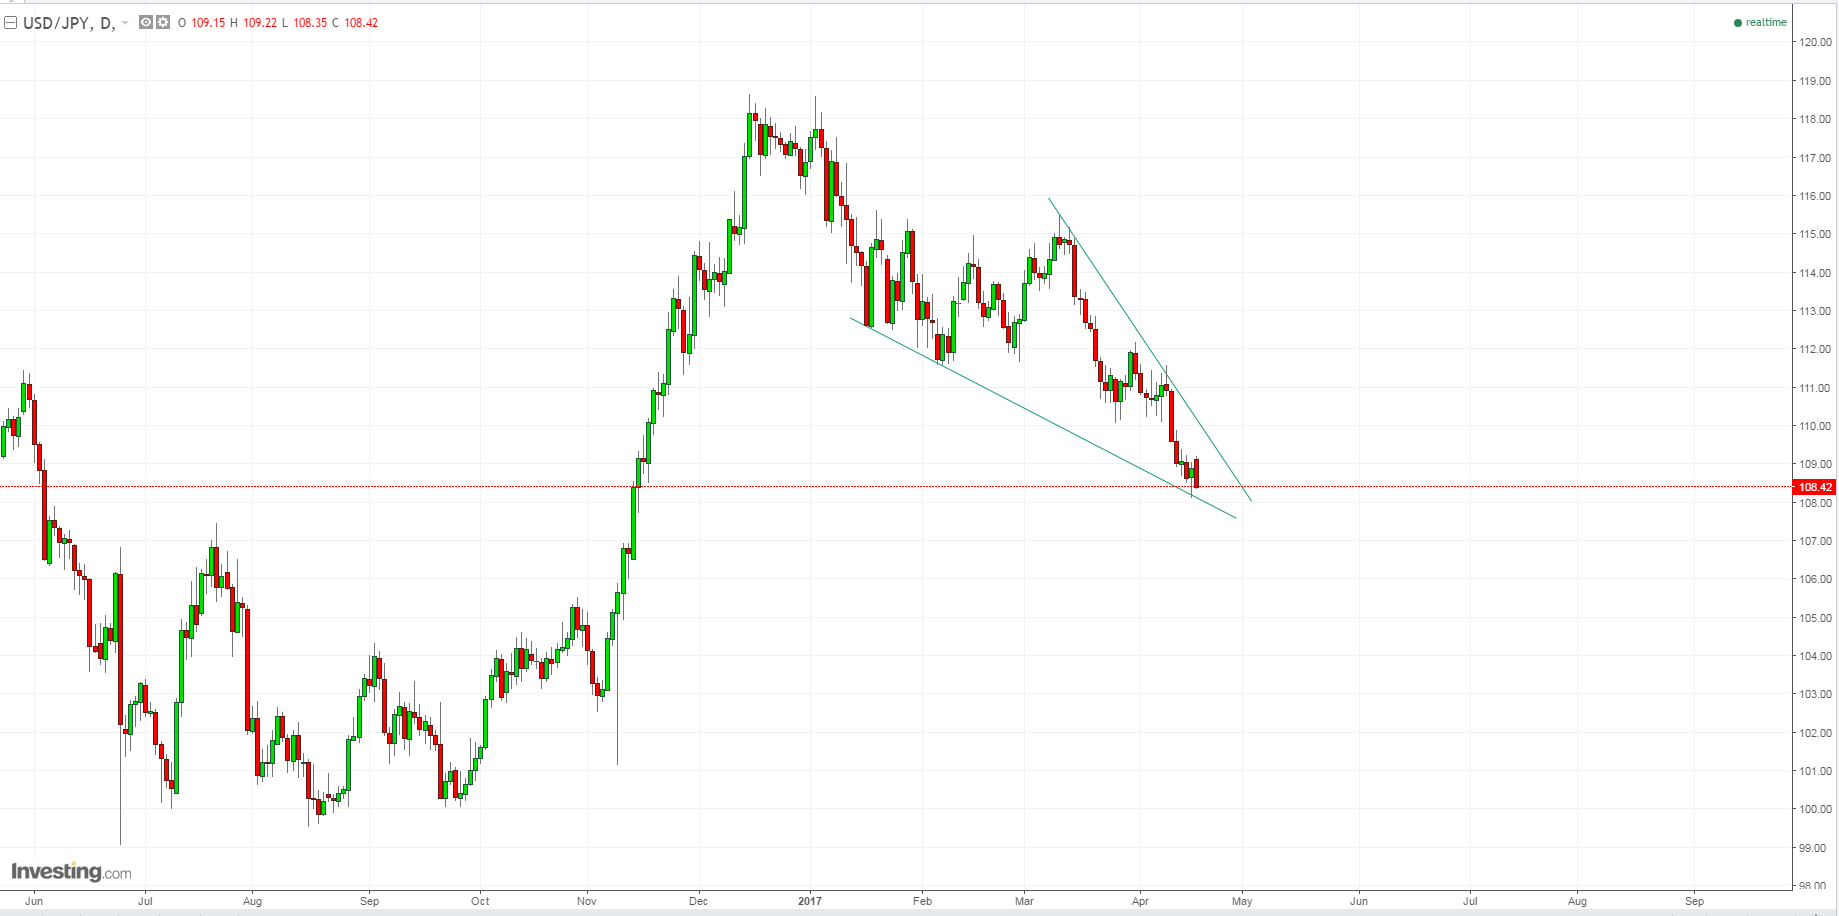
USDJPY says a big move is coming
I can’t put my figure on exactly what pattern this is – between Falling Wedge/Triangle/Ending Diagonal Triangle therefore it’s a bit more difficult for me to guess how it may break. Either way, the USDJPY chart shows some sort of wedge which is close to breaking out/down. That means a big move in PMs, S&P500 and Short term rates could also be on the horizon.
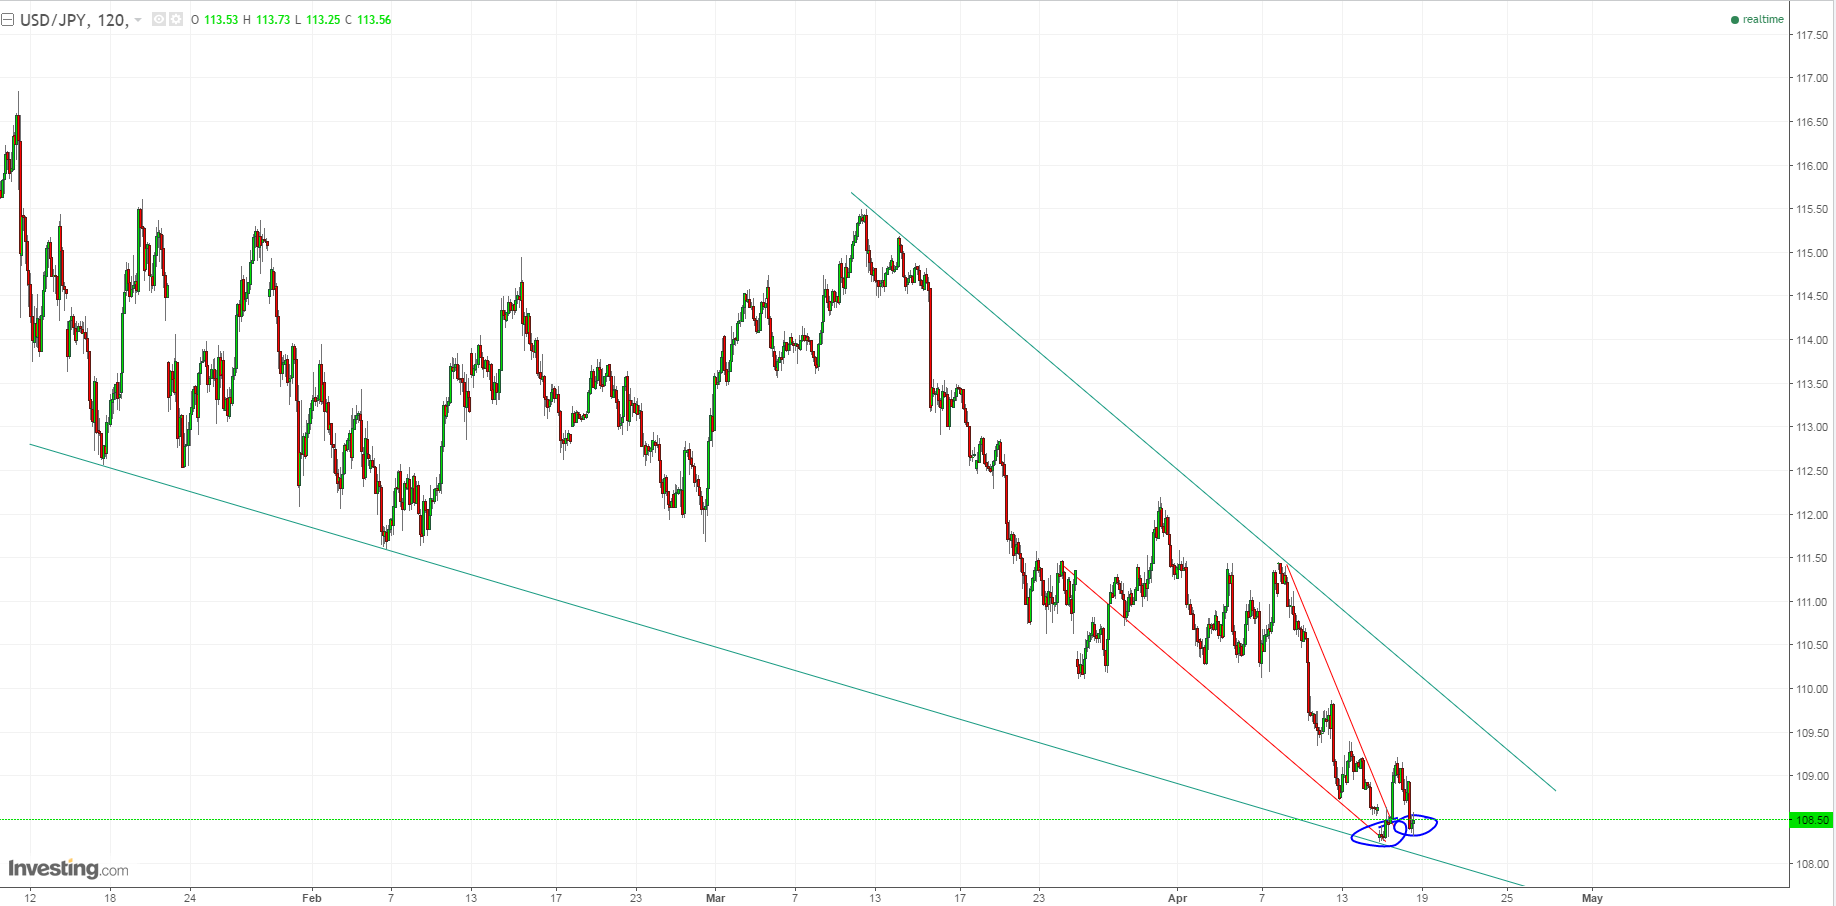
At the moment, USDJPY is back-testing the breakout from the smaller wedge I pointed out yesterday (see below). Currently testing lows around 108.30 for a possible short term double bottom. But if it goes below that level I suspect the larger wedge probably breaks lower. If it holds this level around 108.30, it can test the higher trendline for a possible upward break.
I always look at the USDJPY because it’s closely correlated to so many different things. I find it has the most clear chart patterns compared to the other things it’s correlated to. Remember, miners & PMs tend to do the opposite of the USDJPY.

Until it breaks that bottom boundary I see it as a bull flag
Nice charts Nick. I’m with you. Looking for. Slightly lower low as a possibility.
It’s a long way up, and miners will puke all the way up. That’s why they’ve been selling off.