Gold still flirting with $1250-1260 key line. Intersection coming soon. $1140-1260 range in play.
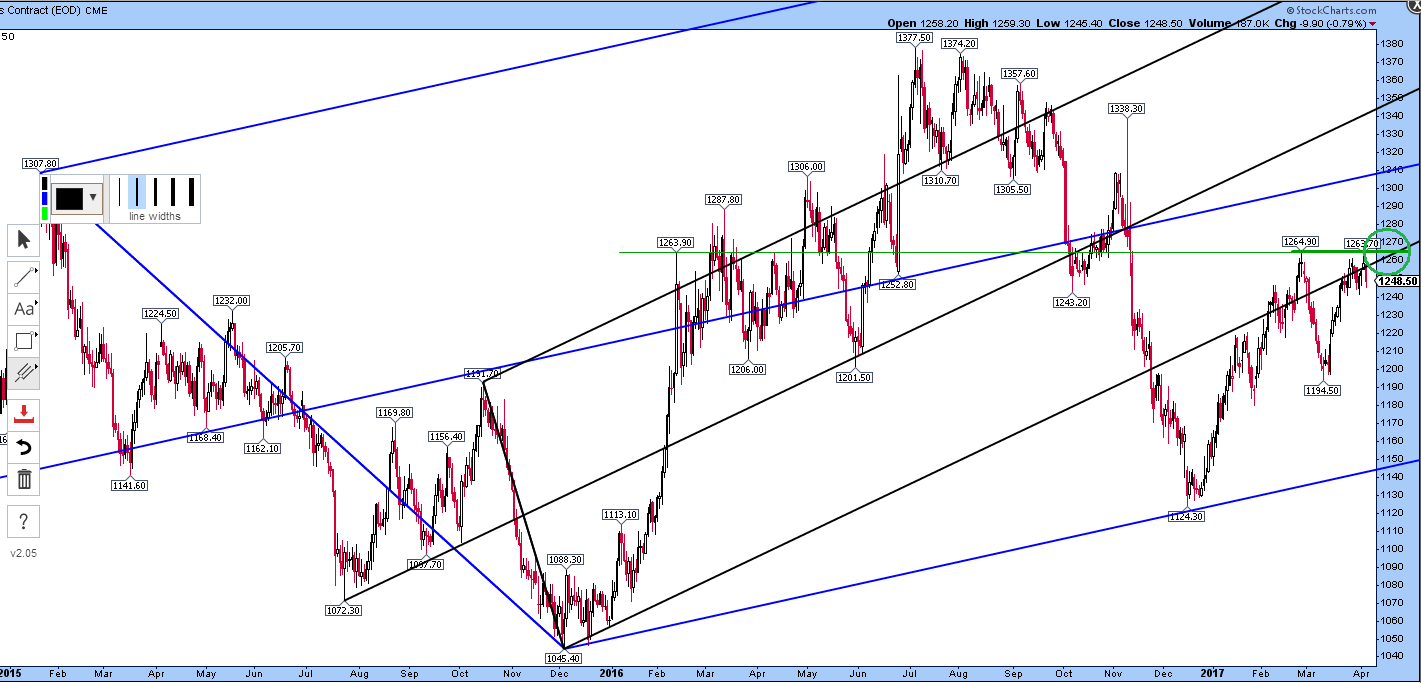
Gold’s price is failing to break above the key line for me at around $1260. My lower black pitchfork line that was support at the very beginning of this bullish run in Dec 2015 is still resistance, resistance with persistence.

I am noting that there is a double top of resistance to overcome at $1263-1264 (green line). This green resistance line meets the up-sloping black resistance of the base of the fork, (right hand edge of chart, green circle. This might be the point at which the decision is made. That’s what I am looking out for. We have seen some decent breaks above the black line over the past couple of month but they still failed to penetrate ‘meaningfully’ back into the fork.
It may be that the black fork is now defunct, in which case the blue fork is probably in play and the range will be $1140-1260 for a while. Of course, the black fork slopes up quite steeply, so the scenario could still eventually be bullish even if price never gets back into it and it will be left behind. Since the blue fork actually runs parallel to a much larger gently up-sloping fork going back to 2011 (not shown), it wouldn’t surprise me if the blue one dominates now and the black fork is becoming defunct as merely defining some features of the initial rally in early 2016.
What still surprises me pleasantly in that the Trump election dump in gold occurred right when the two median lines of these forks met last November (2016) and these forks were originally drawn as far back as Jan-Feb 2016.
I just noticed that the recent resistance at $1263-1264 coincides with the top of the impulse leg of the first run of the potential bull market going into mid-2016 (thin green line). That’s interesting, well, if you are interested in that sort of thing. So $1264 is a key level indeed.
Thanks for the update Dave–very useful…
Dave – Someone got your memo on the the forks intersection with resistance “drawn as far back as Jan-Feb 2016” and hit the launch button!!! Gold at $1267 overnight. Some of these “predictive” chart intersections scaring the @#^% out of me.
Cheers!
I’m almost surprised that gold has penetrated back into the black fork as of 12 April by going up as far as about $1276.Of course, it has penetrated in there before recently but been repelled back out again, going as high as about $1264.
Really I see the big blue fork as the slow track of a potential bull market and the black fork as the fast track. I thought the fast track black fork was getting abandoned since the severe correction in lats 2016 but that would not necessarily be disastrous since it encompasses the initial impulsive upmove and a correction would have been expected.It is interesting that this black fork is being reclaimed with the move above $1264 today. See if it lasts!