The US Dollar
Although I’ve been studying TA since 1978 and have learned quite a lot about chart patterns, use of various indicators, etc, I rely a great deal on friends who know far more than I do. That’s especially true when it comes to Elliott and Gann.
The research piece below I deem to be very important because (1) it deals with the one particular market that likely has more influence on the precious metals than any single other, and (2) the place in time we currently find ourselves.
While I greatly respect Rambus and am inclined to agree with his bearishness on Gold for the Intermediate Term, there are other analytical methods that give a more guarded view of the mighty US Dollar, thereby mitigating much of the bearishness toward gold, at least for us here in “Dollar Land”.
Time will give us the answer as to which analysis was most accurate.
******************************************************************************************************************
U.S.DOLLAR: Reasons for a High March 28, 2017
The dollar tends to follow a cycle of approximately 8 years. It is therefore not too often that the currency would be expected to arrive at a major point in time with regard to its long term rhythm. The current quarter however may prove to be one of those times. In the charts and descriptions which follow we will elaborate on a number of observations concerned with price and time. All of our information supports the idea that the dollar has reached a high. Some of our charts will present some complexity but we’ll start today with a monthly which is simple and straight forward.
Cash U.S. Dollar Index: Monthly Chart (1)
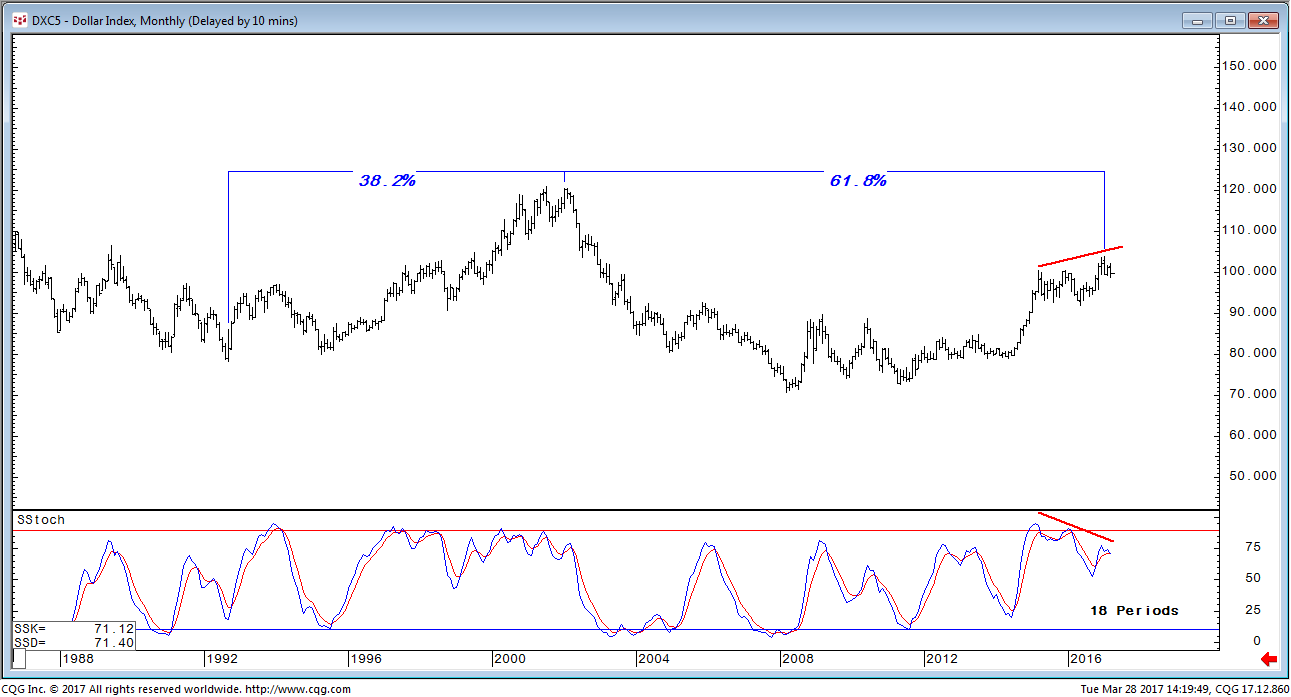
The chart above shows a Fibonacci golden section which relates the timing of two past significant market turns to the recent January high. Accompanying the last high is a long term momentum divergence which contains multiple occurrences. The divergence is obvious as prices have climbed to new highs since March 2015 with momentum peaking at progressively lower readings. The foregoing is indicated with red lines. With the month of March having only 3 trading sessions remaining, it is very possible the oscillator will crossover to the downside by month end. If it does not, it will nevertheless leave the dollar in a potentially precarious position. Realizing this potential we will now move on to other more quantifiable evidence.
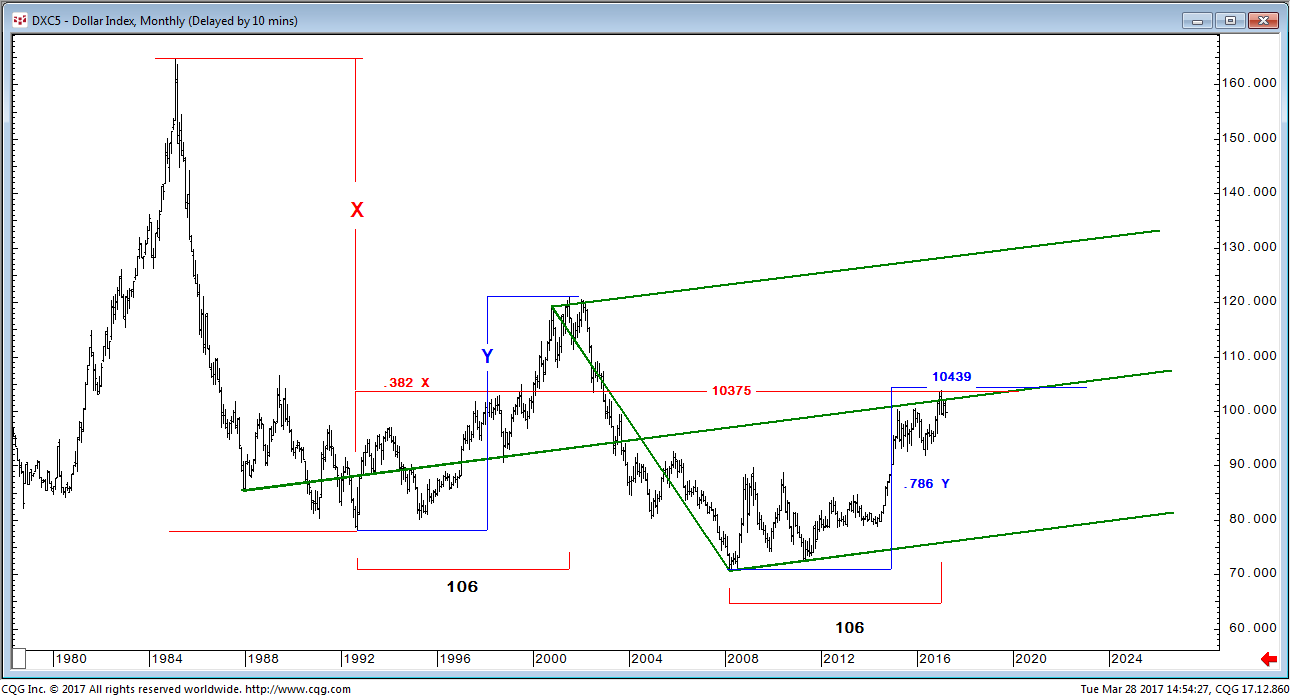
Our next chart is also a monthly. There are a few important points to note here. First is the Fibonacci 38.2% retracement level of the 1985-1992 decline at 10375. That level has been exceeded but in our estimation remains an important resistance area relative to the foregoing 7-year decline. A second more recent development is the current rally from March 2008 into 2017 and the fact that the move was very close to achieving a Fibonacci 78.6% relationship to the preceding 1992-2001 rally. The relationship would be exact at 10439. The January cash high was 10382. Perhaps the least ambiguous factor and really the most important is the fact that both the 1992-2001 and the 2008-2017 dollar rallies were 106 months duration. In calendar days, the first rally was 3,229 days and the second rally was 3,214 days. Given the magnitude of the time duration, that’s about as close to equal swings in time as we could possibly hope to find.
Cash U.S. Dollar Index: Monthly Chart (2)
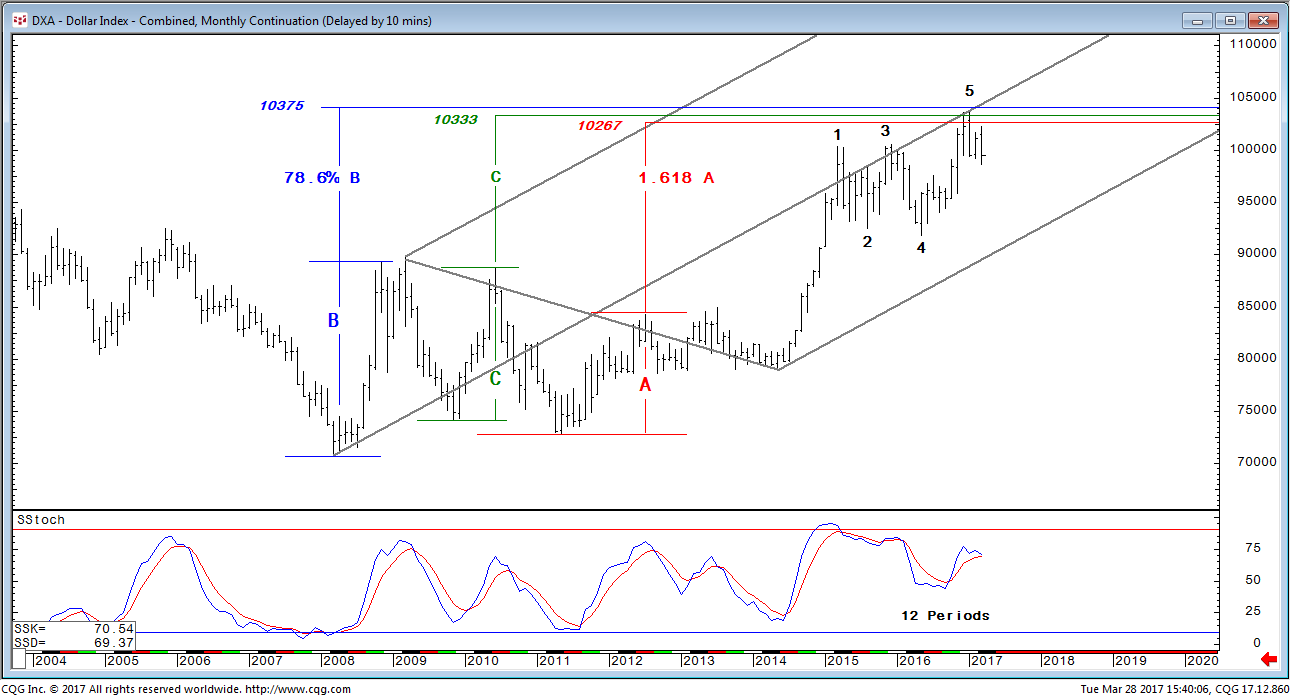
We started big picture with a couple of monthly cash charts and we will continue with a monthly chart which follows. This one however is futures. Our focus here will be primarily on price as we examine the recent 2017 high relative to 3 of the preceding trading ranges which occurred between 2208 and 2012. The three ranges in descending magnitude are B, C, and A. What we did was to test for common swing relationships which repeat in all markets and whether the dollar high in January 2017 was a reasonably close “fit” which would suggest the attainment of a typical measured objective. Actually, it is the attainment of 3 objectives coincidentally. For the B range, we applied the Fibonacci 78.6% ratio and then added the result to the B high. Similarly, we did the same for C and A applying equality to C and the Fibonacci 1.618 expansion to A. The resultant targets noted on the chart for each of the ranges was 10375, 10333, and 10267. The high on the monthly futures chart was 10381.5. Two of the three proved to be very close supporting the idea of having reached an objective.
Another factor on this monthly chart is the Andrew’s pitchfork and the fact that the median line although penetrated, eventually provided strong resistance. Interestingly, the penetrations were progressively less over time, perhaps a meaningful sign to remember in the future. Our old reliable “friend,” the 5-point reversal pattern, also materialized on this monthly chart with the 5th point accompanied by a momentum divergence.
We thought this chart was going to be primarily price oriented but we can see now it more accurately represents a synergy between, price, patterns and momentum.
U.S. Dollar Index: Monthly Chart (3)
+++++++++++++
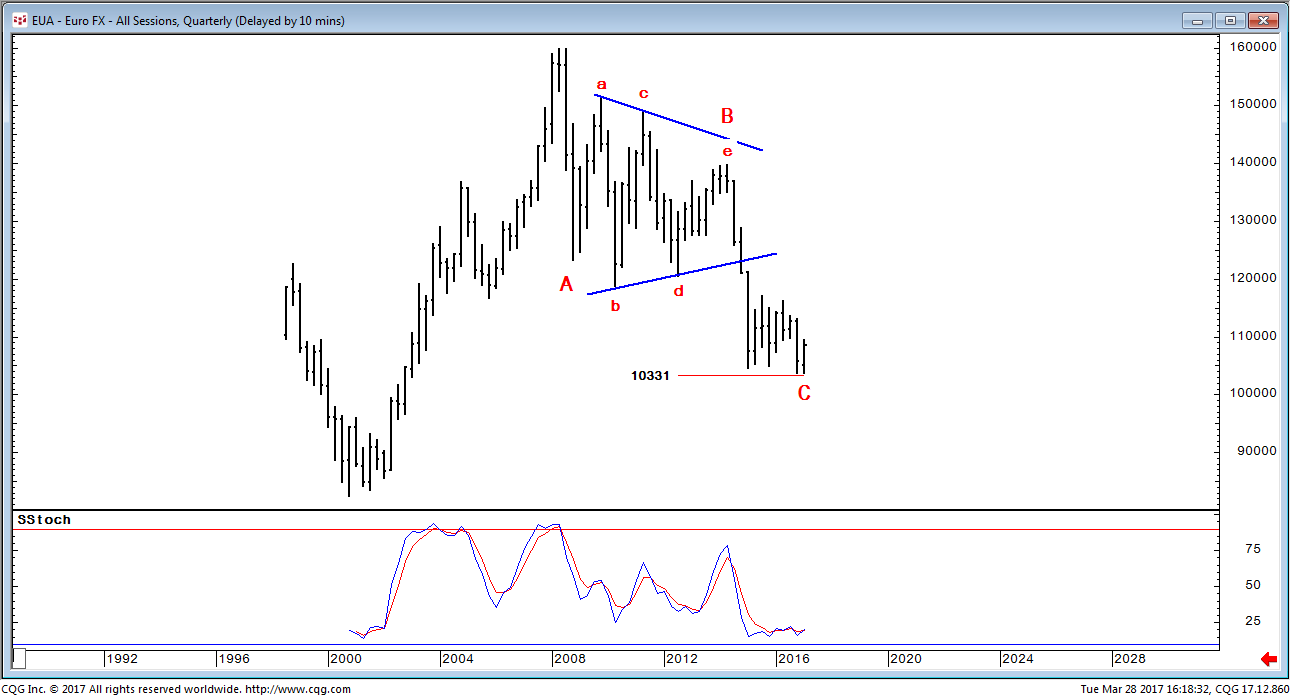
We will shift gears here and effectively back into other evidence which is worth noting. Anyone involved in the market recognizes that the Euro currency and the U.S. Dollar Index traded inversely. Below we are duplicating a quarterly Euro chart. It was from a January 20, 2015 article we wrote (Euro(FX): Longer Term Bearish Possibilities). Basically, we thought then that the currency was in a massive triangle and coincidentally the B-wave of a major A-B-C correction. Equality between waves A and C, a very common relationship, projected to target of 10331. Admittedly, we had a few targets but this deeper one was not closely approached until mid-December 2016 at the 10367.5 nearby low. If that was a significant low, it provides us with an additional warning vis-à-vis a possible the dollar high.
Euro(FX): Quarterly Chart (4)
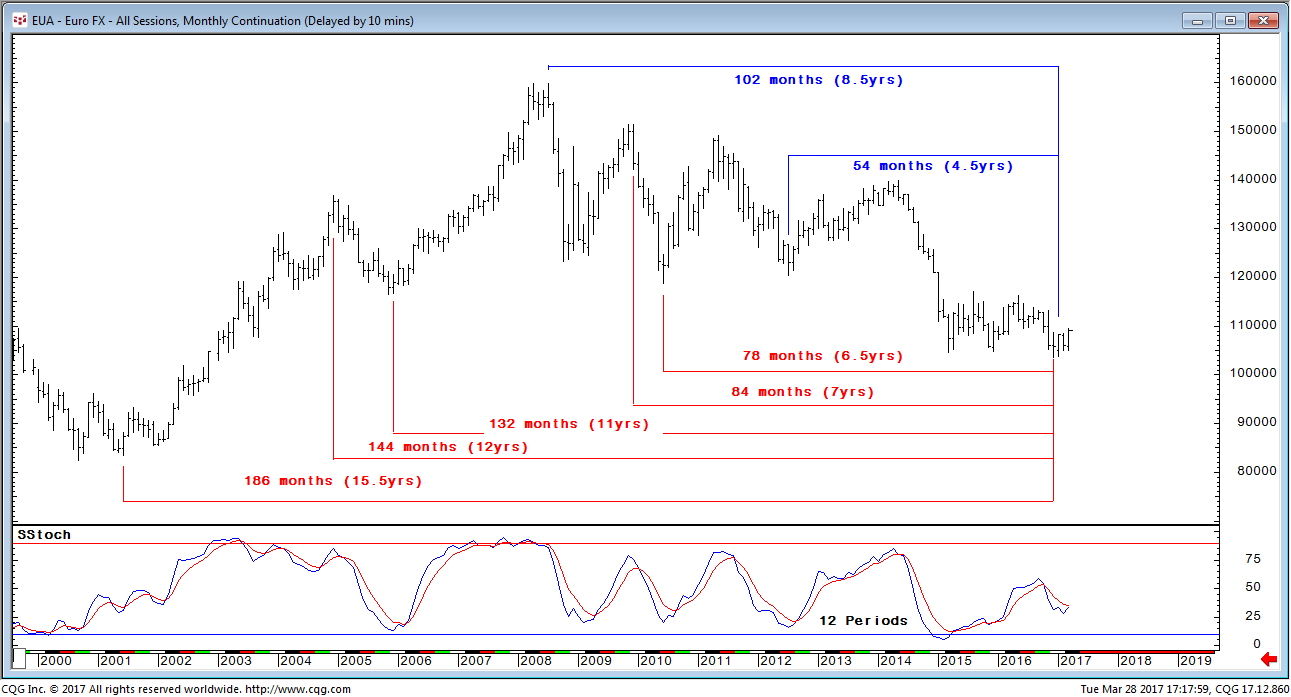
We have one final chart on the Euro which follows. It is monthly and concerns the element of time. We have illustrated anniversary years and half-years from previous significant market turns. Some of the intervals are well known Gann cycles in addition to anniversary periods (7 and 12 years). The fact that we have a sizeable cluster with terminations in the December/January period definitely adds to the probability of a euro low. The lows in December and January at 103675 and 103735 respectively, are so close in value that both may be considered as cycle terminations and certainly within the normal allowable variance of plus/minus 1 bar on the chart when dealing in time. Please also take note of the stark one-year momentum divergence (bullish) beneath the price chart.
Euro(FX): Monthly Chart (5)
Wow all the heavy hitters get a mention! WD Gann, Fibonacci, Andrews..
Great post – thank you.
We need Schism to run his Fibonacci time counts over that last chart of the Euro as I think the USD and Euro are more aligned to Fibonacci time counts than those used by WD Gann.
Along with Spock, Graddhy and a few others I am in the bear camp with regard the USD and suggest we are at a pivotal “time” for both the USD and gold.
Very impressive post and extremely compelling, I am glad I am on the right side of it or I would have now been reconsidering my conclusions.