Gold Cycle Update
Charts from Friday but just getting around to posting. Busy weekend…
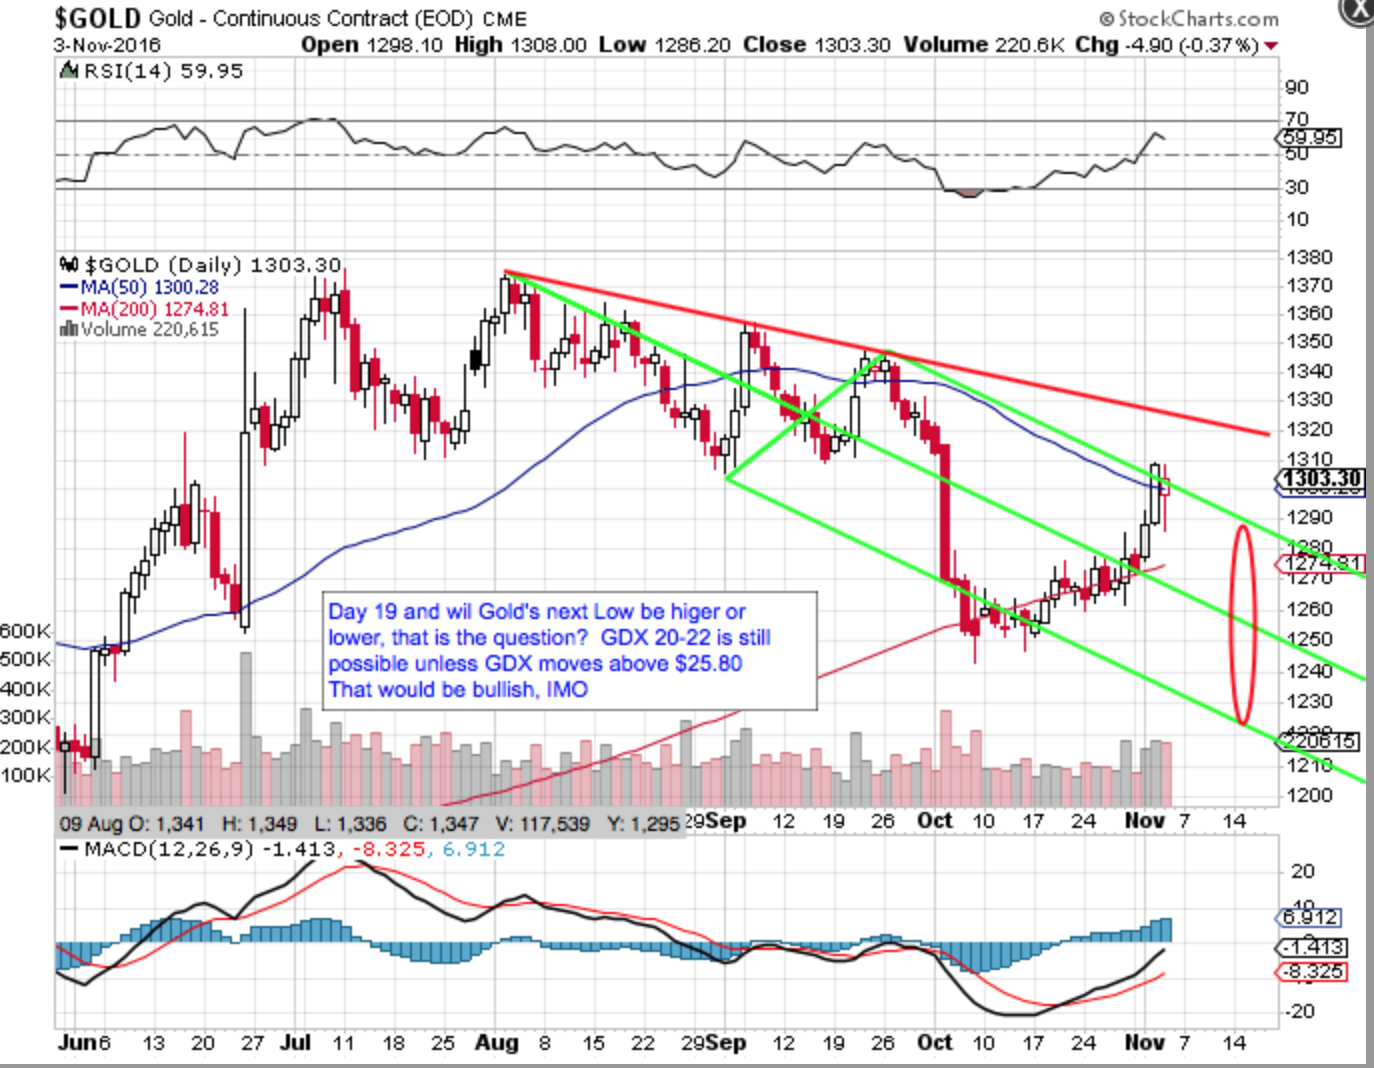
Gold’s YCL may be behind behind us and Gold has been bullish of late but it is also late in the short term trading cycle. A higher TC Low would be bullish. If we get a lower low, it should be the YCL.
I have Gold on day 19 which is “toppy” from a Time perspective (TC lows ave 23-29 days) and 1315-1322 is strong resistance.
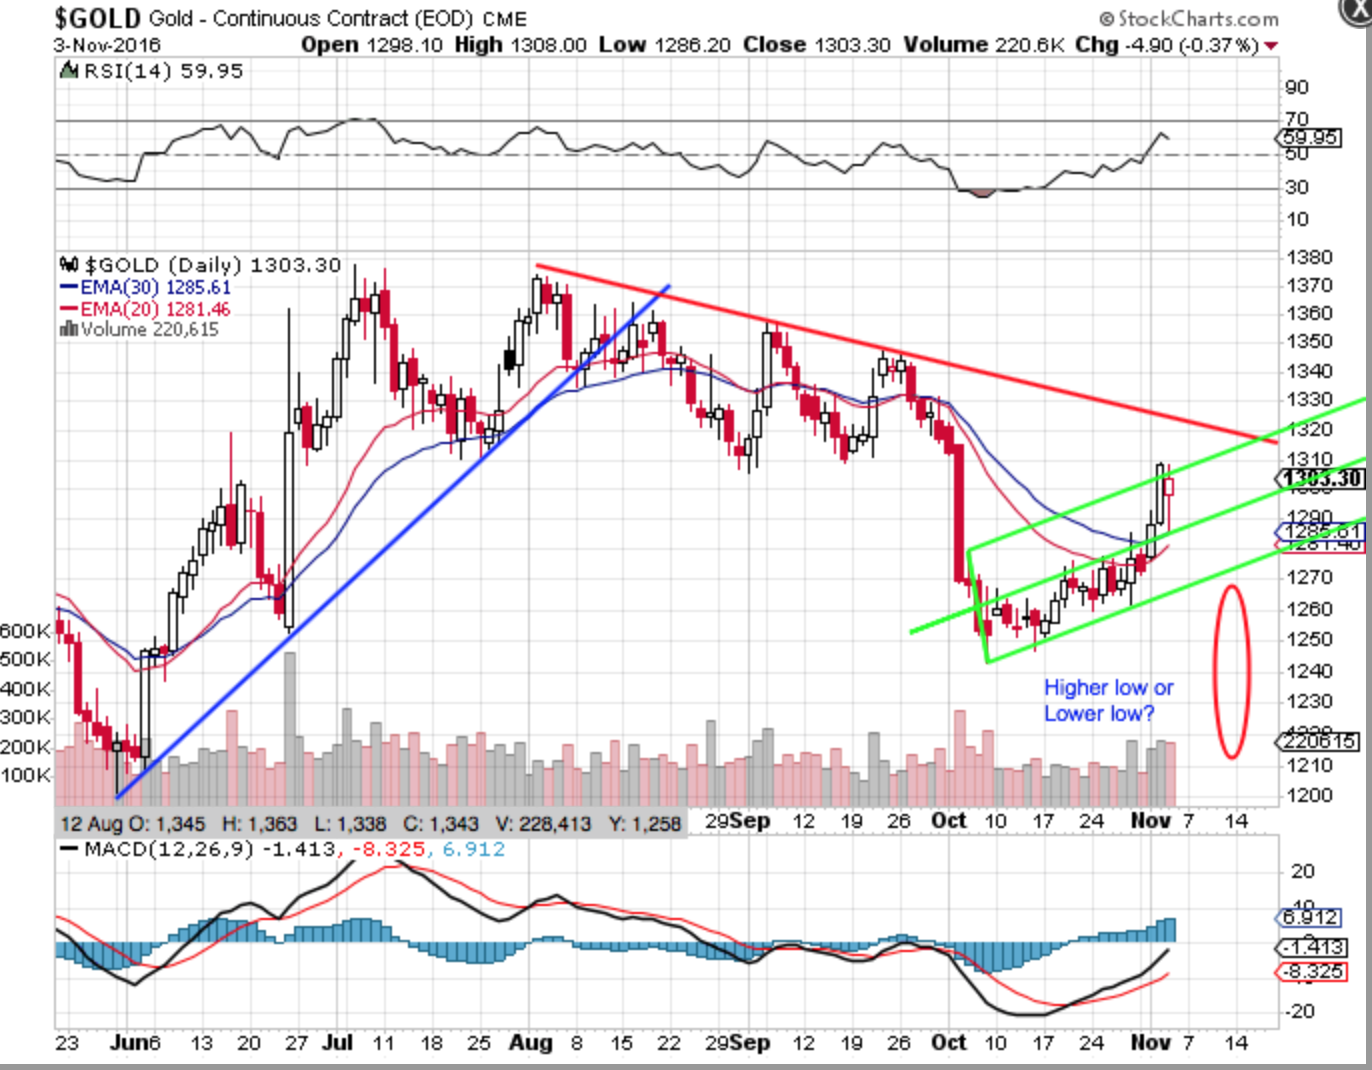
My first two Gold charts are daily of the price action since the double top in early August.
The top red line is critical and should only be broken when the IC Low is behind us. That is up in the 1315-1322 range and that is a big task this late in a Trading Cycle (see 3rd chart).
But the next low could be a higher TC Low which would be bullish.
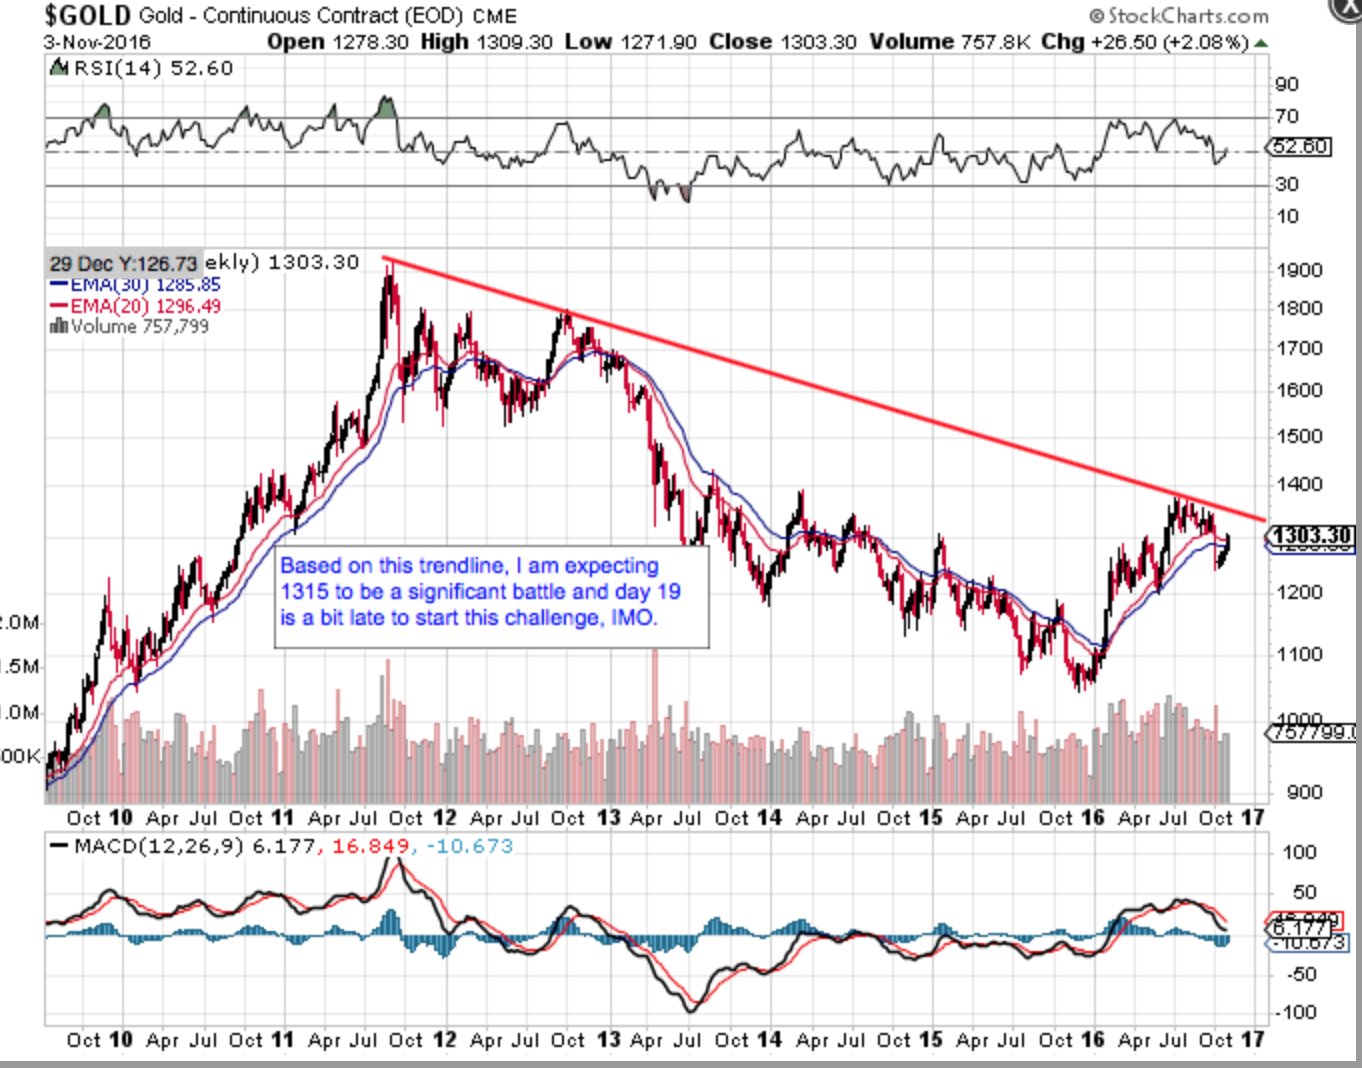
3rd is a long term Gold weekly showing strong resistance in the 1315-1322 range.
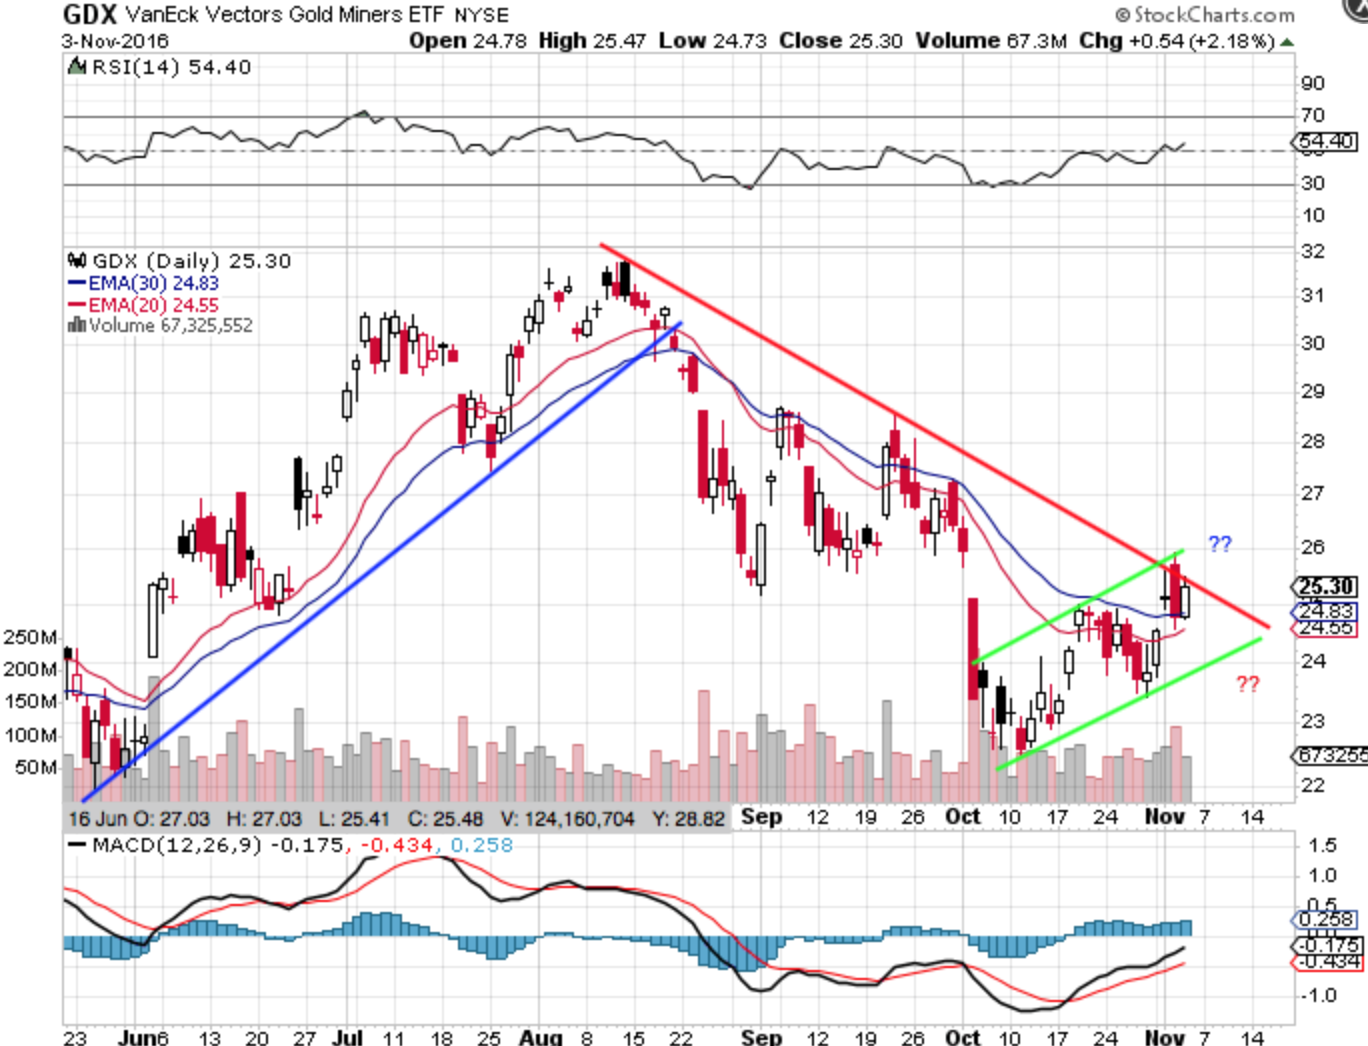
4th Chart on GDX.