SPX Yearly Cycles
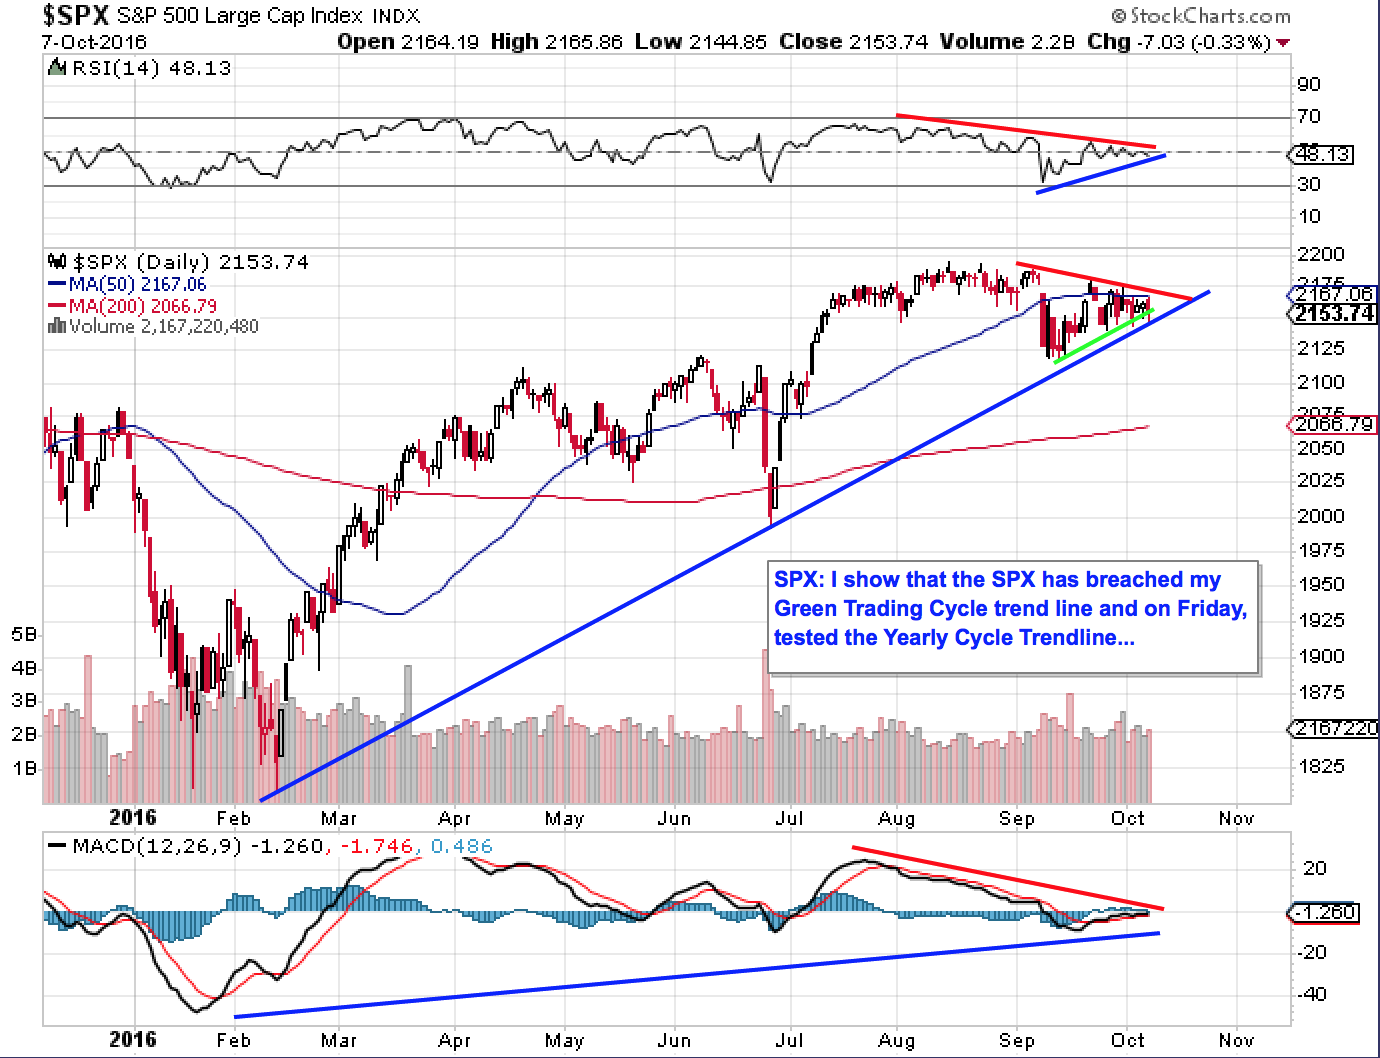
My first chart shows that the SPX tested it’s Yearly Cycle uptrend line on Friday and has breached both its Intermediate Cycle and Trading Cycle uptrend lines on Friday.
My second chart shows that the DOW has been breaching and backtesting, its Yearly Cycle uptrend line for over a week now.
On Friday, the DOW closed below its YC Uptrend for the 3rd time…
Will the 3rd time be the charm? Time will tell. 😉
From a Time perspective, I am expecting the SPX YCL in the Mid-Nov to early December timeframe.
On Friday I added to my initial SPXU starter position from earlier this week.

Added: One last chart show the SPX’s last two YCLs after my YCL uptrend was broken.
