Gold Intermediate Cycle
I have Gold on day 17 of it’s current Trading Cycle and Norvast has identified Oct 9-10 as a very likely date for a Low based on his Time base Fib & Lucas Triangulation calculations. Oct 10th would be day 28 and in my timing band for a TC Low. Will the next TC Low also be the longer 5-6 month Intermediate Cycle Low as well?
That is the key question as early October is only 4 months from the last IC Low on May 31. It may also be possible that we get one more Trading Cycle into November before the final IC Low is in. Watch my Red IC downtrend line for clues. When Price breaks to the upside, that will likely signal a new Intermediate Cycle (bullish).
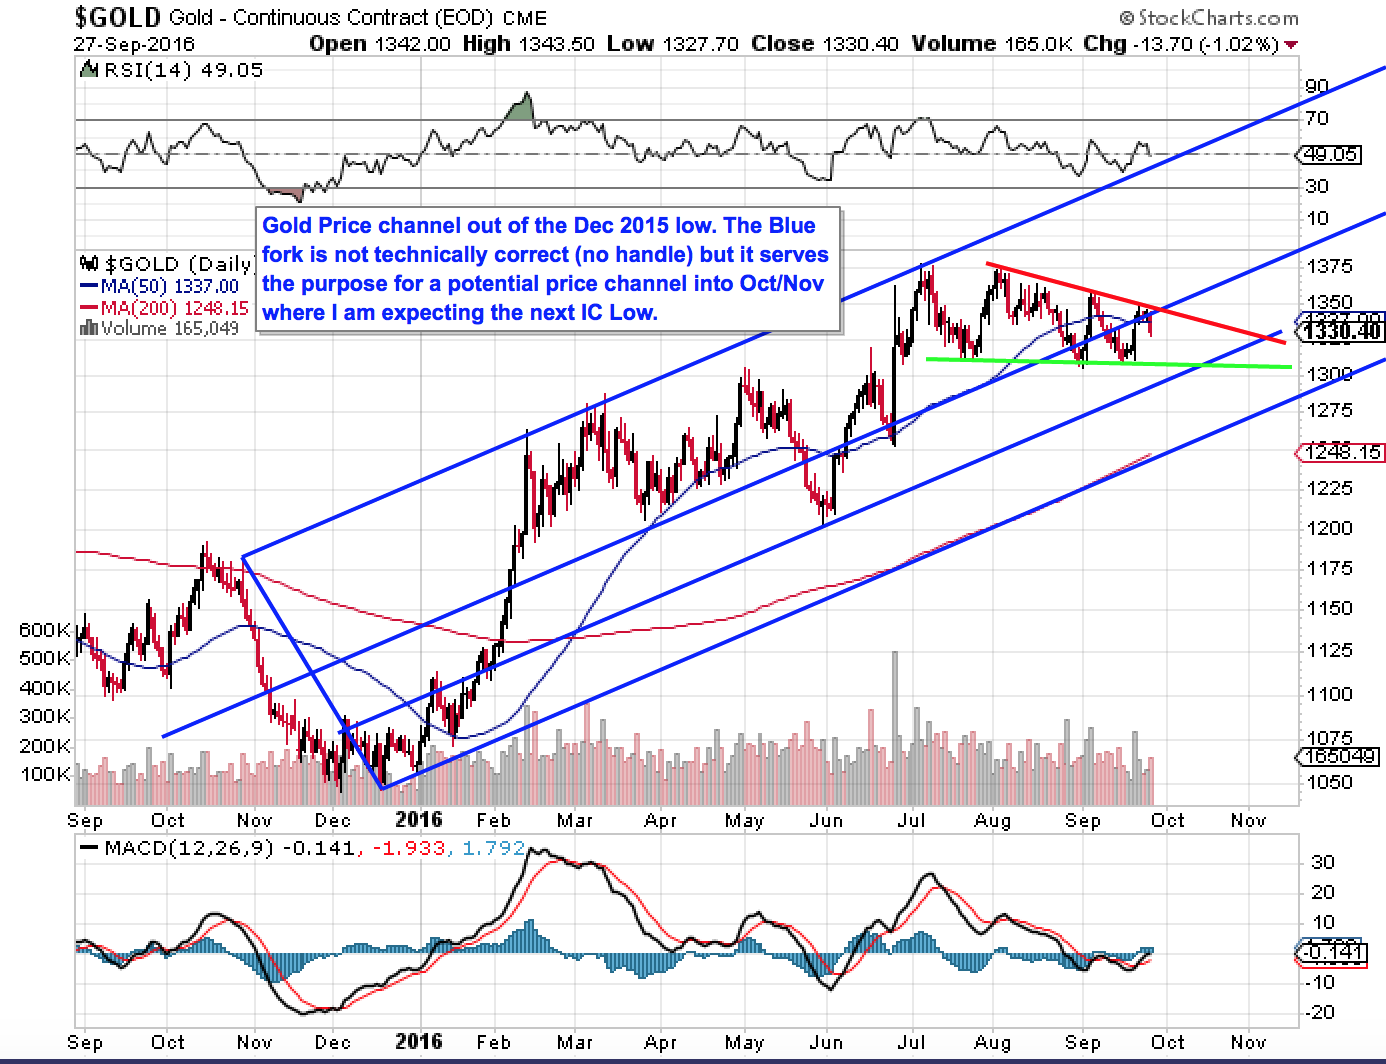
My first chart shows the close up action. My second chart shows a potential Price Channel out of Dec 2015 Low. While the Fork is not technically correct, I consider it valid as a potential channel where the next IC Low could test or break the lower Fork line.