USD Intermediate Cycle
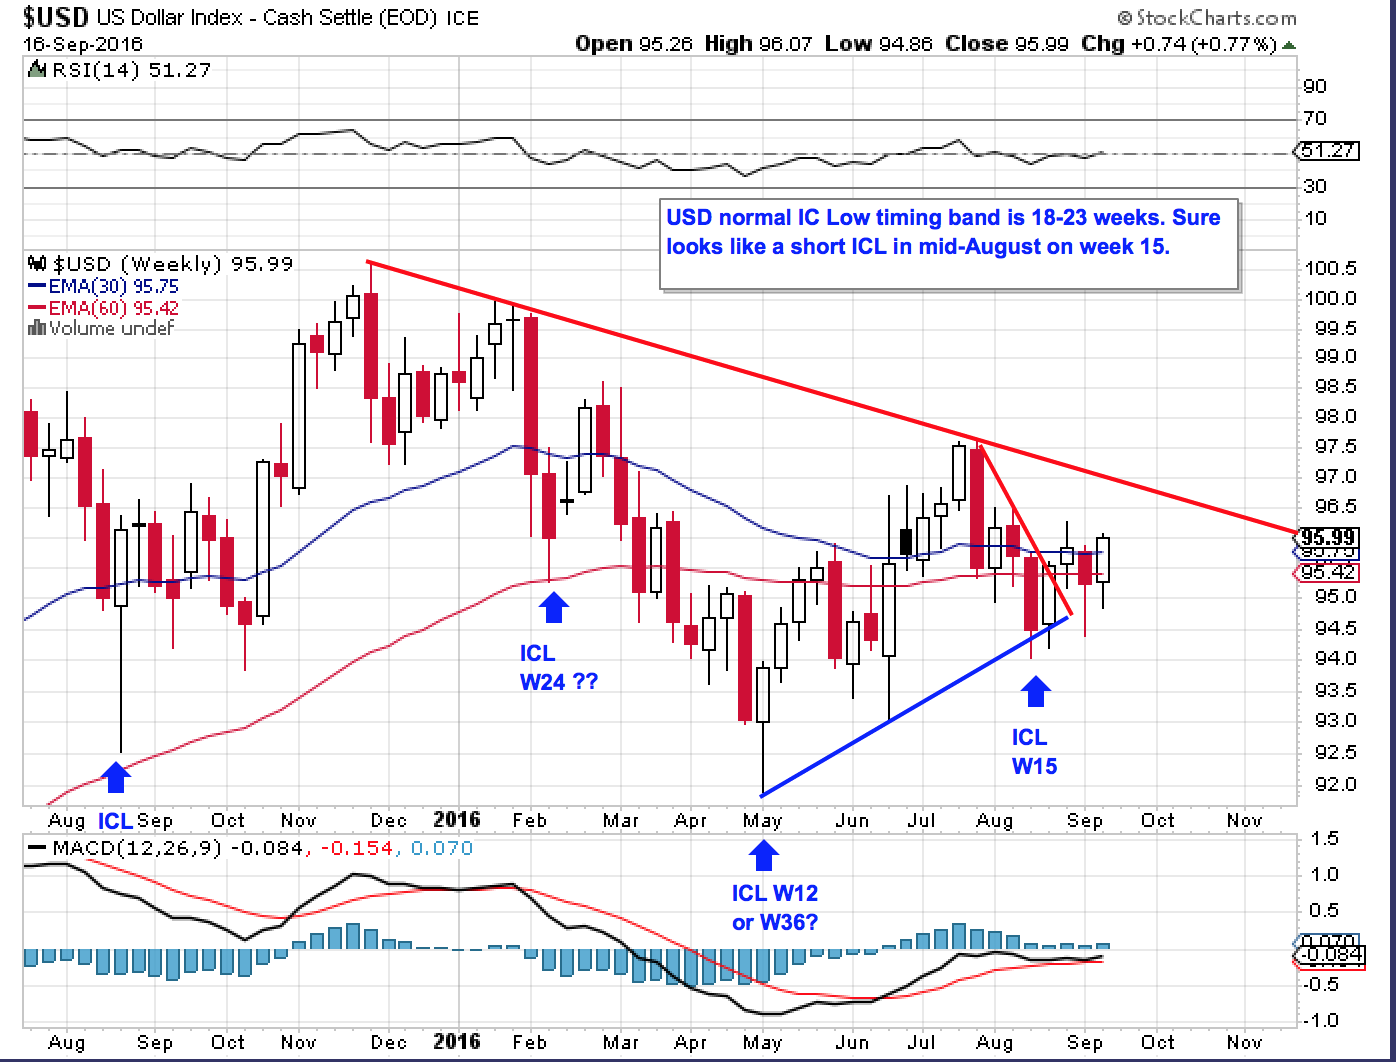
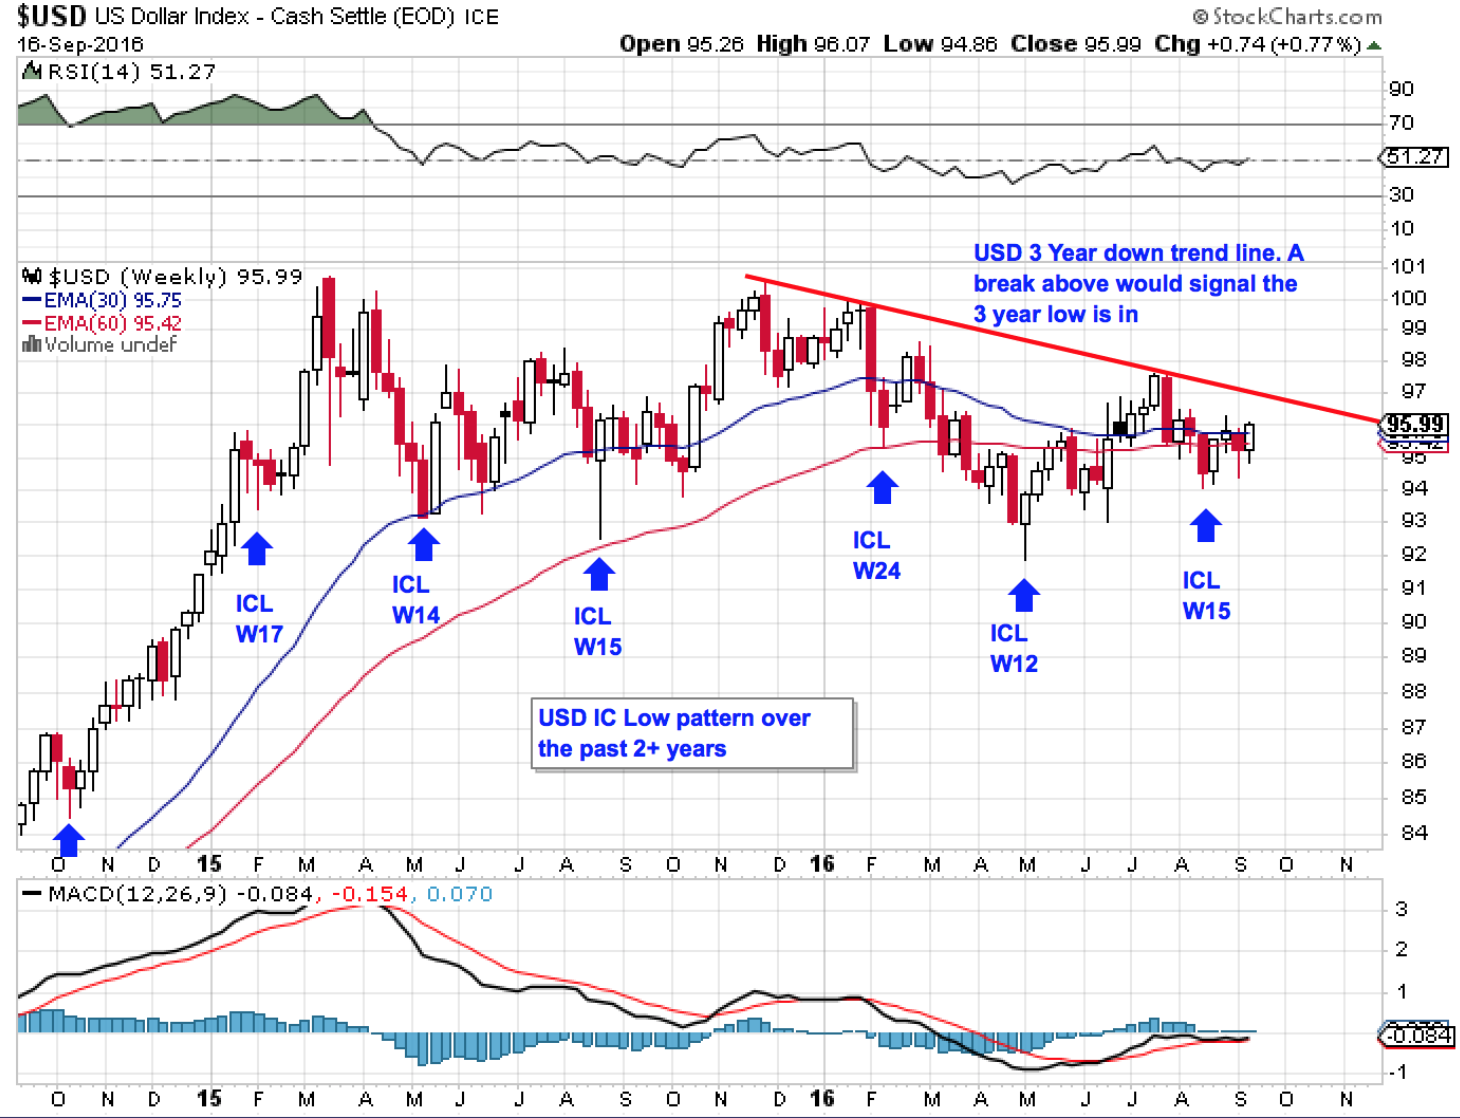
The USD’s move today sure looks like it made an Intermediate Cycle Low (ICL) in mid-August on week 15 (see 1st chart). If correct, this would now be week 4 of a new Intermediate Cycle with the next real resistance at the 3 Year Cycle down trend line. My second chart shows the ICL patterns over the past 2+ years.
Normal timing band for ICLs is 18-23 weeks so the second chart shows they have been running shorter. Note that the longest ICL on the chart at 24 weeks also had a TC Low on week 15 so a 12-15 week cycle low pattern is emerging.
Do you mean “the longest ICL on the chart at 24 weeks also had a TC Low on week 15”?
With the USD rising and still early in this cycle before it tops this does not auger well for gold over the next 3-4 weeks which still has some time to run in its current trading cycle.
Maybe a short reprieve next week before gold falls into a DCL (or ICL) in the second week of October.
If it was an ICL gold would have returned to a shorter Intermediate Cycle (19 weeks) similar to those in 2014-2015
I have the SPX quite volatile during October in the lead up to the election.
Yes, good catch as it was 15 weeks into the Dec 2015 TC Low. I have made the correction.