Gold and USD Cycles
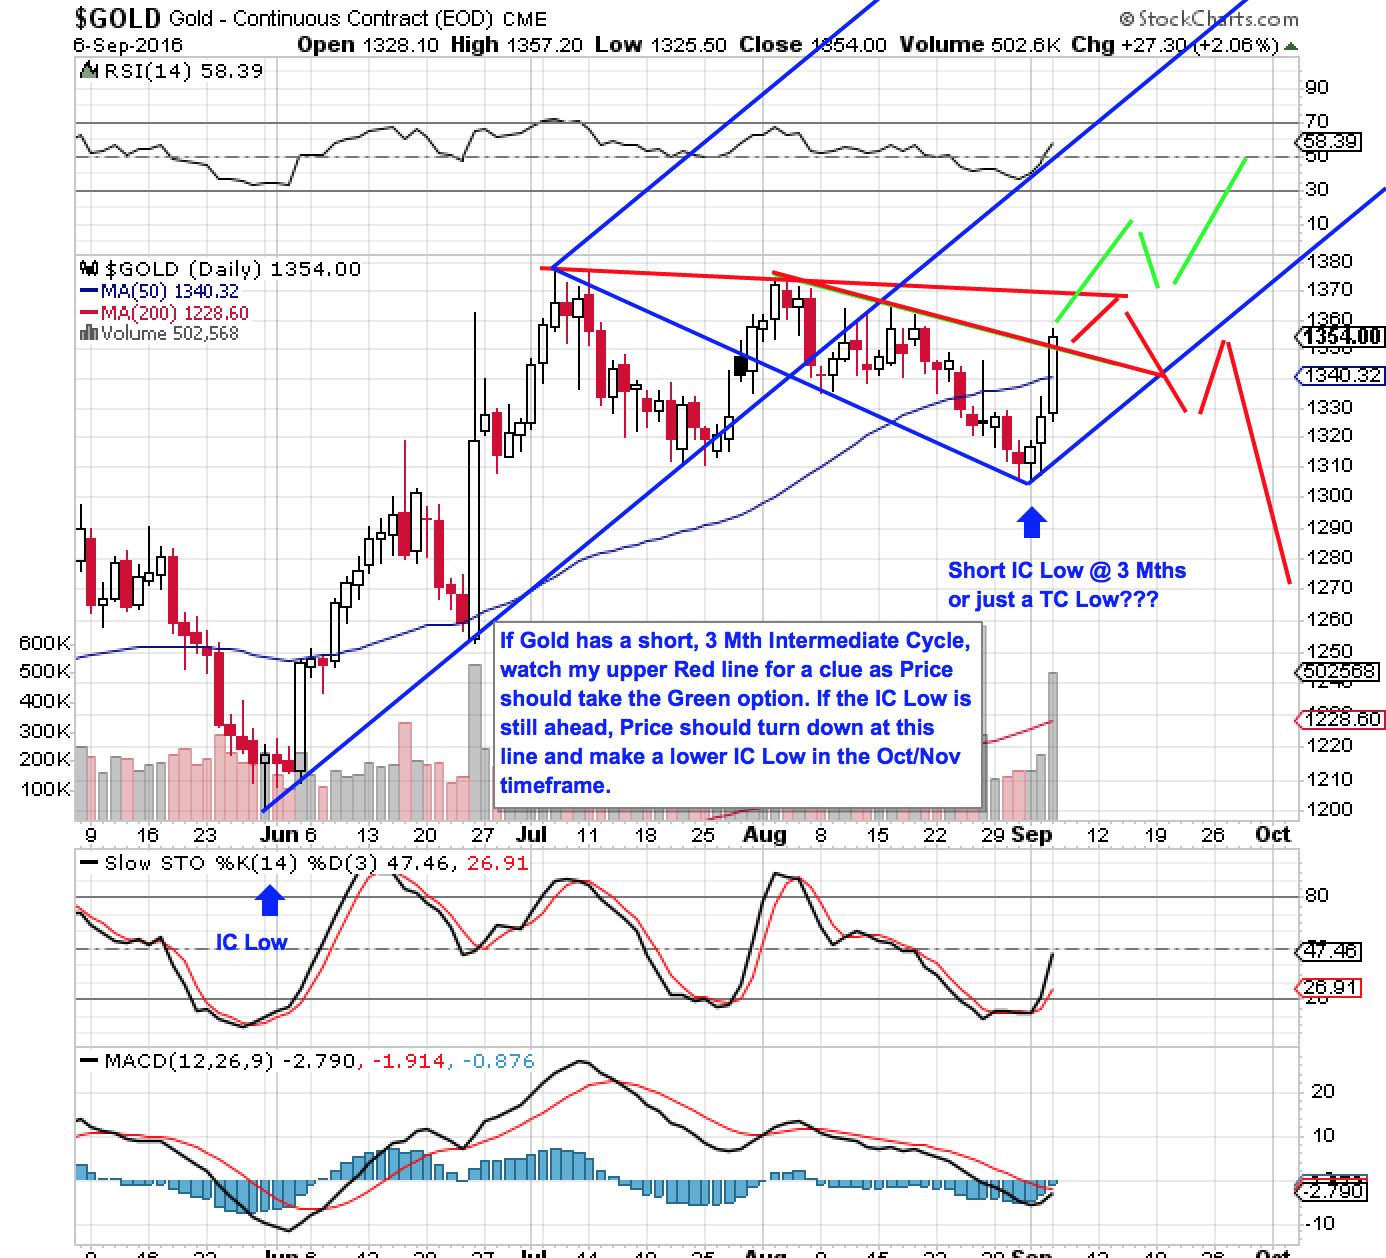
Either Gold has delivered a very short Intermediate Cycle Low at 3 months or this rally will top out near my top Red downtrend line and move into a lower IC Low in the mid-to-late October timeframe. Normally Gold Intermediate Cycles last 5-6 months low to low and I show the last one in late May.
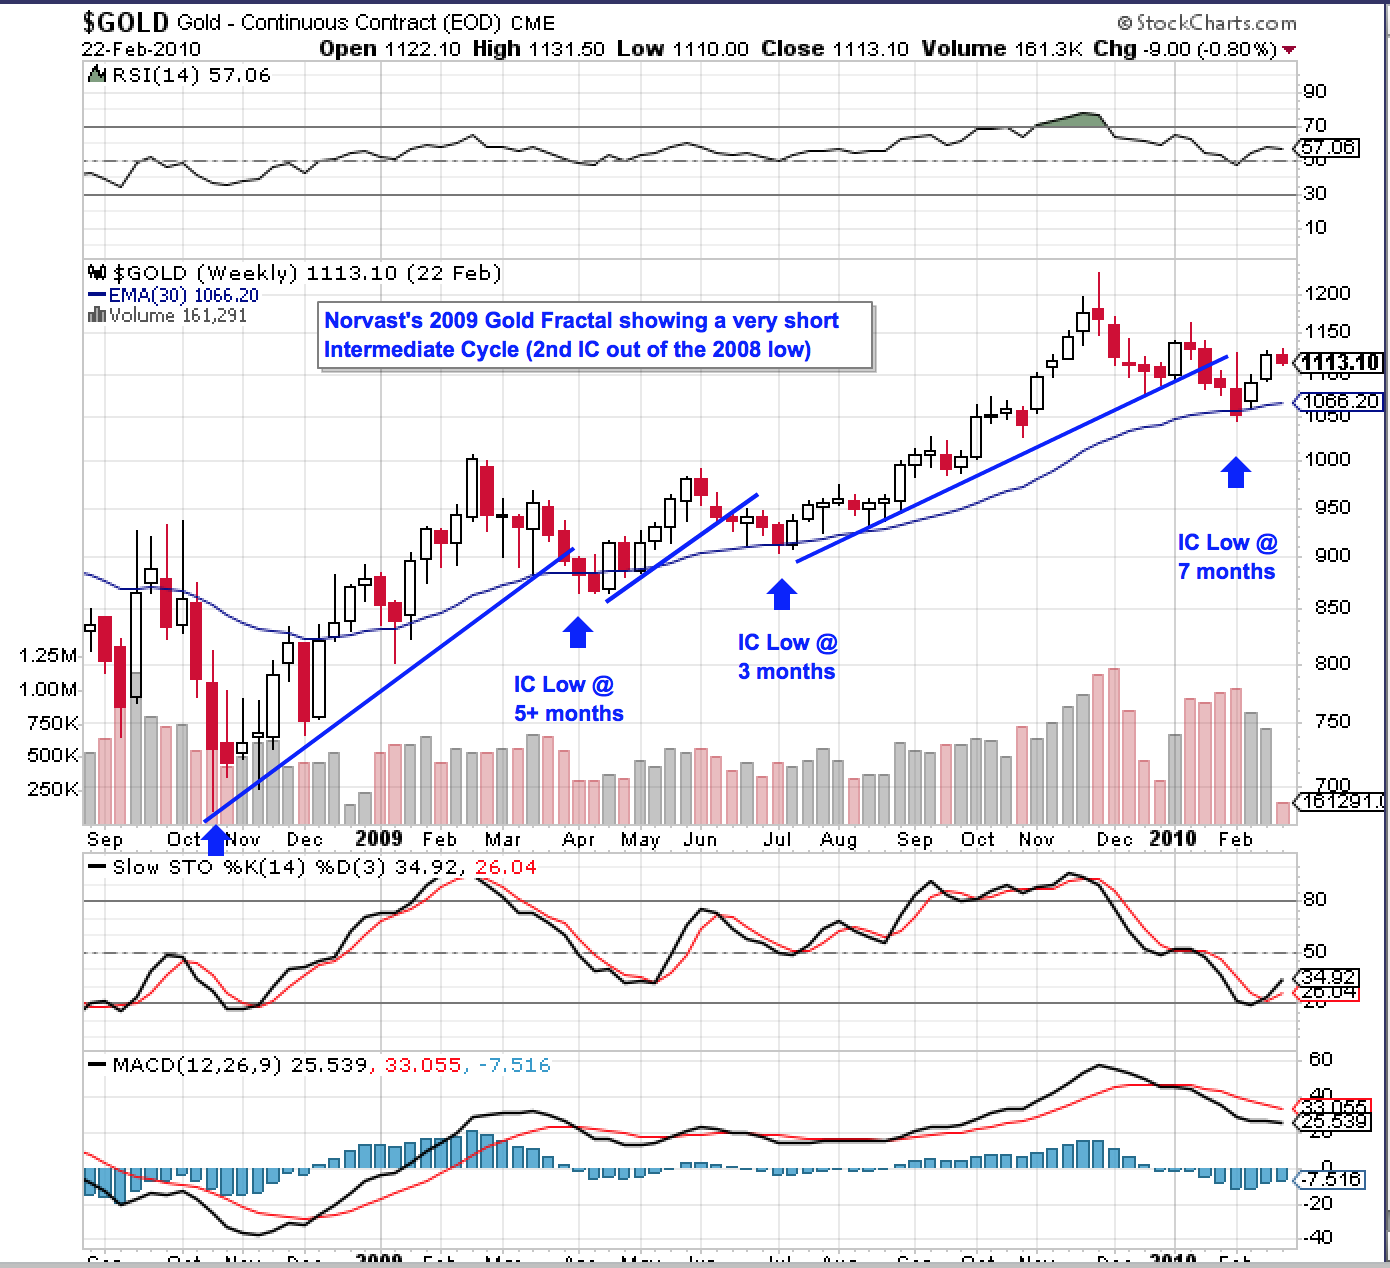
My colleague, Norvast of Gann, however, considers 2009 his primary “Echo Year” for this current move out of the Dec 2015 Bear low. In 2009, Gold also had a very short 3 month IC Low during its second Intermediate Cycle out of the 2008 bottom (see my 2nd chart). We are also in the 2nd Intermediate Cycle so watch my upper Red line and Blue fork for Clues on how this rally will play out.
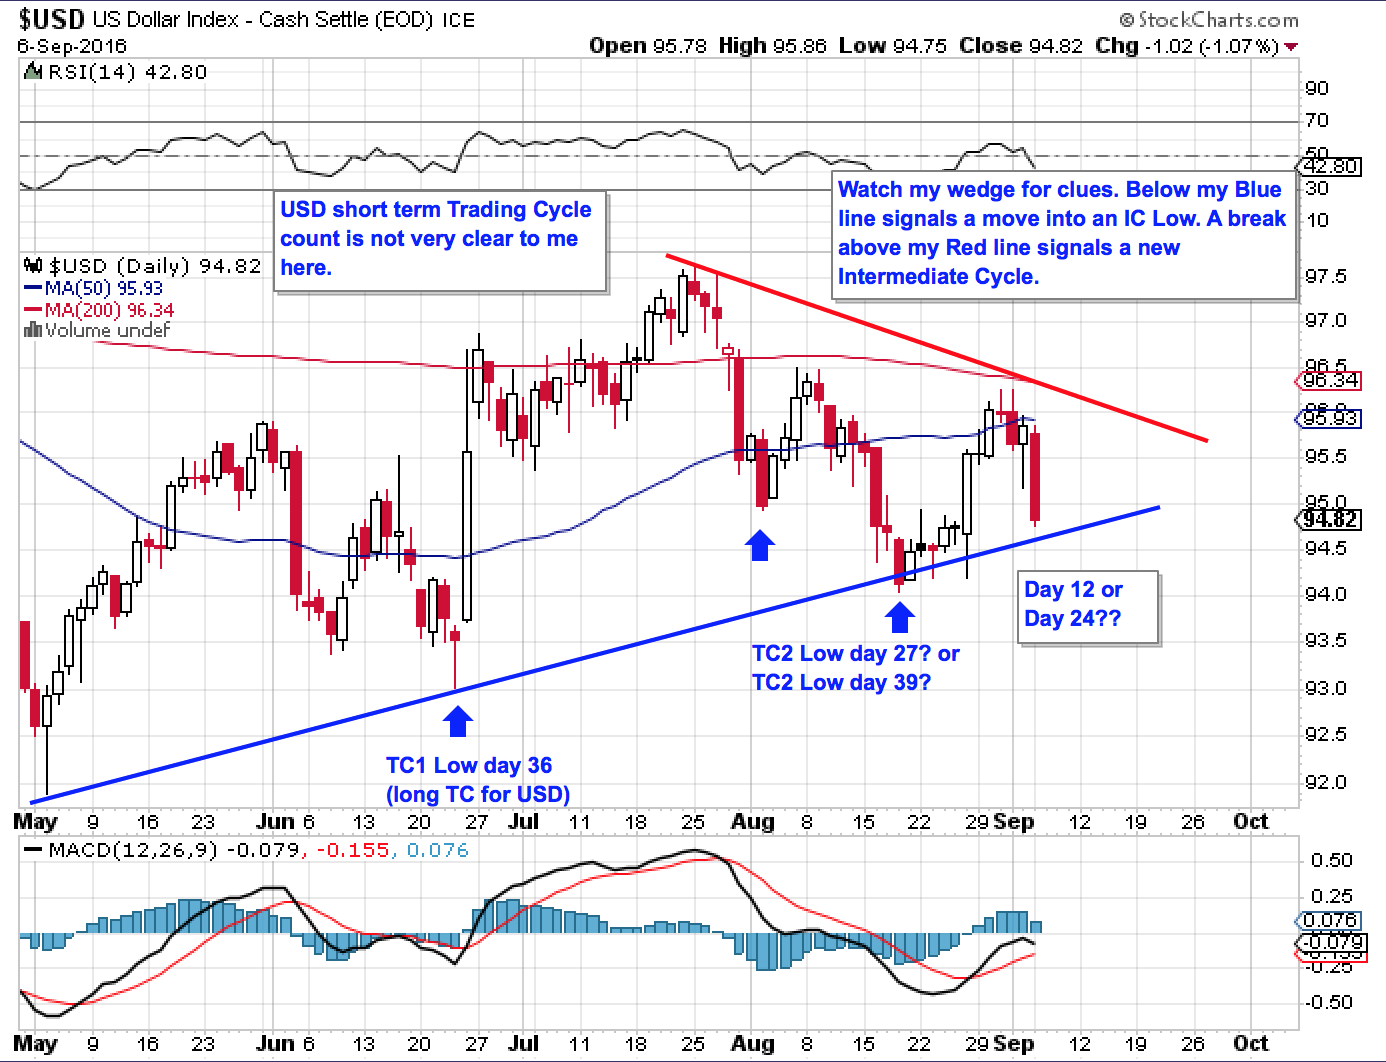
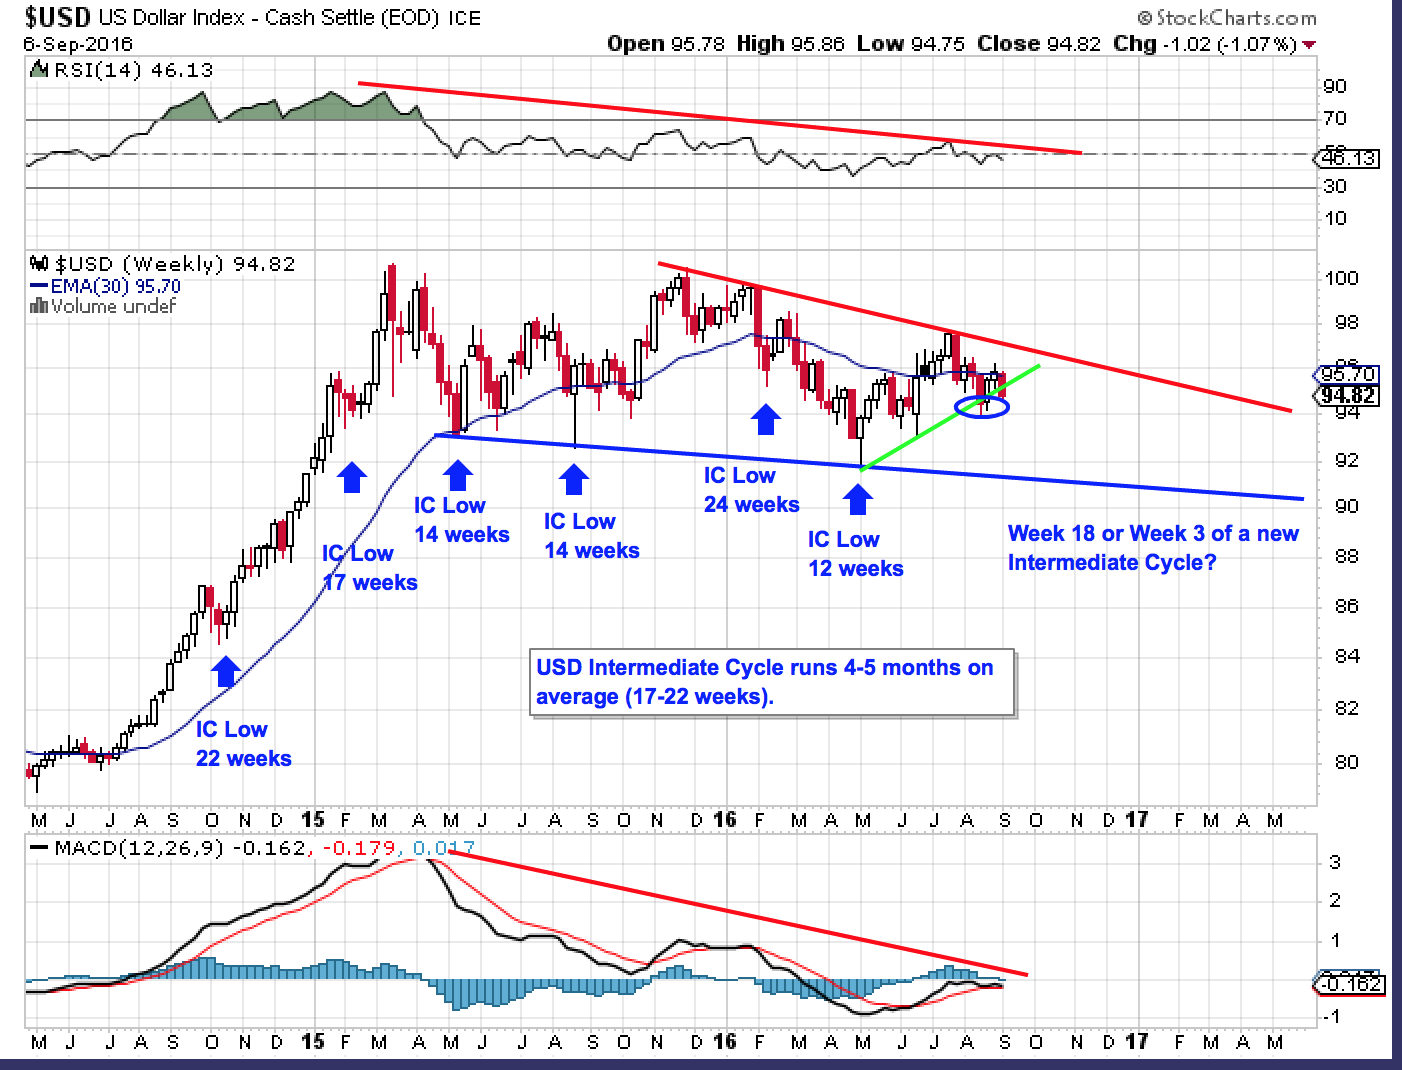
The USD’s shorter Trading Cycle counts are a bit clouded here but we have entered the early part of my timing band for the Dollar to start seeking out its IC Low here (if it is not already in…). My first chart shows the close up action over the past 4 months and my second chart is a weekly showing the pattern of IC Lows over the past several years.
Very nice and much appreciated charts and comments. Couple of nasty up gaps on GDX, too. Thank you.
your gold red pattern will complete the H&S pattern…
Thanks. Sept 12 oil report may tell more about $ trend.