Gold and Miner Cycles
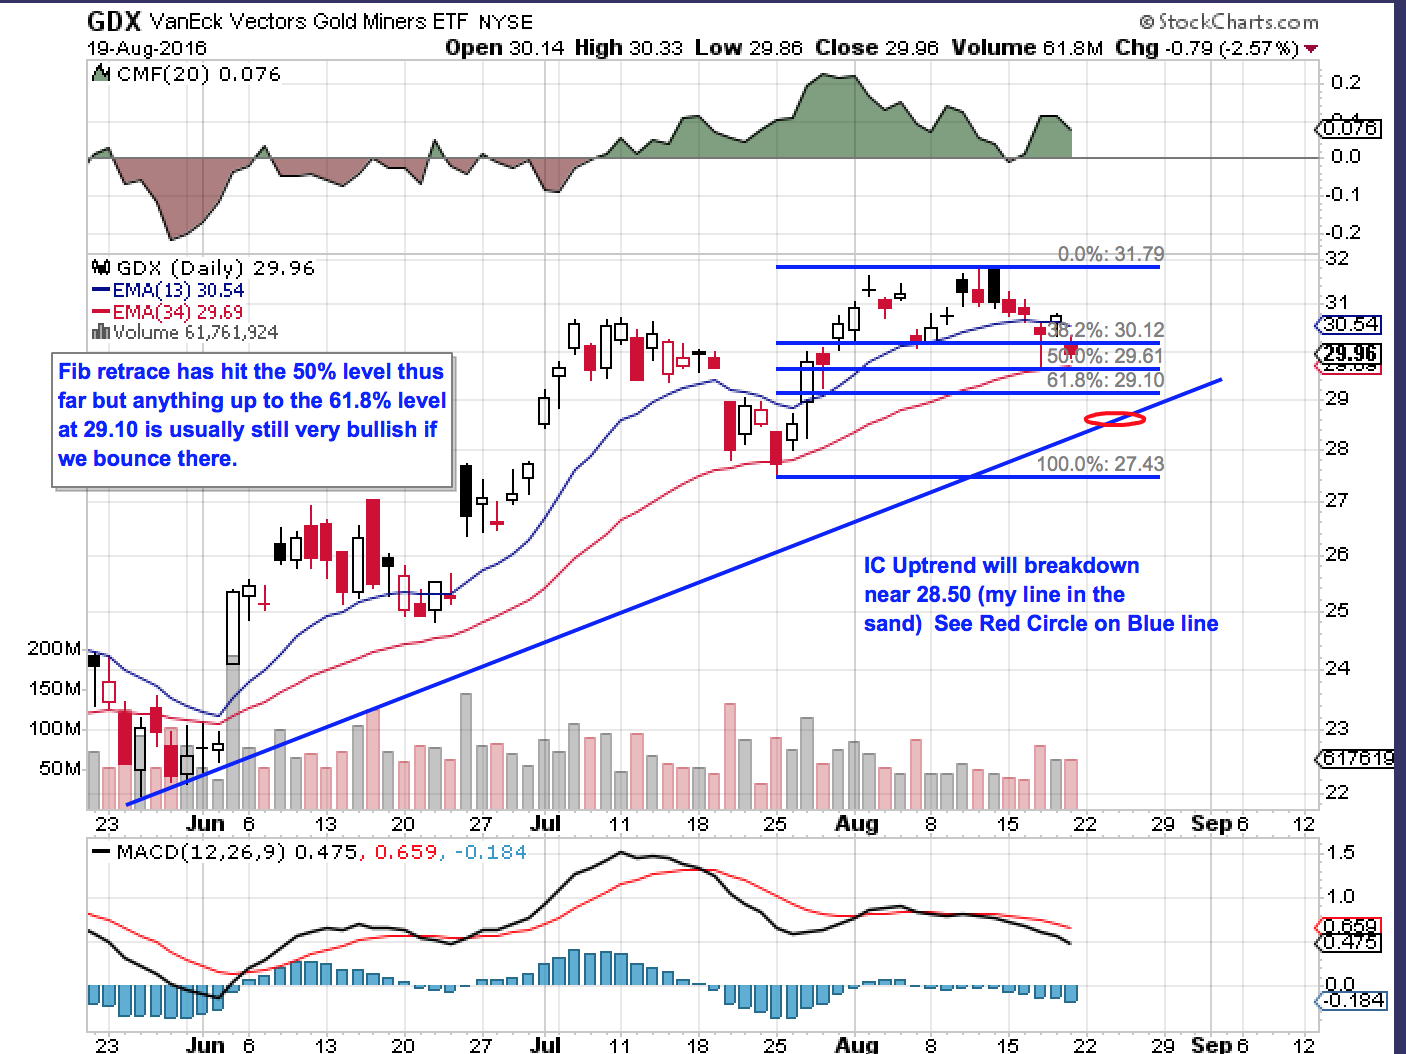
This update will focus on the Miners (GDX is my proxy) both from a shorter term Trading Cycle (TC) and the Longer term Intermediate Cycle (IC). In my first chart, I have GDX entering it timing band to start seeking a TC Low on day 19 after having found a TC High on day 14. The chart also starts at the last IC low for Gold and the Miners in late May, with the Miners finding an IC high (so far) just a bit shy of 3 months. I personally don’t want to see the TC Low move below the 62% fib level on my chart but a move down to my blue trend line would not be the end of the world.
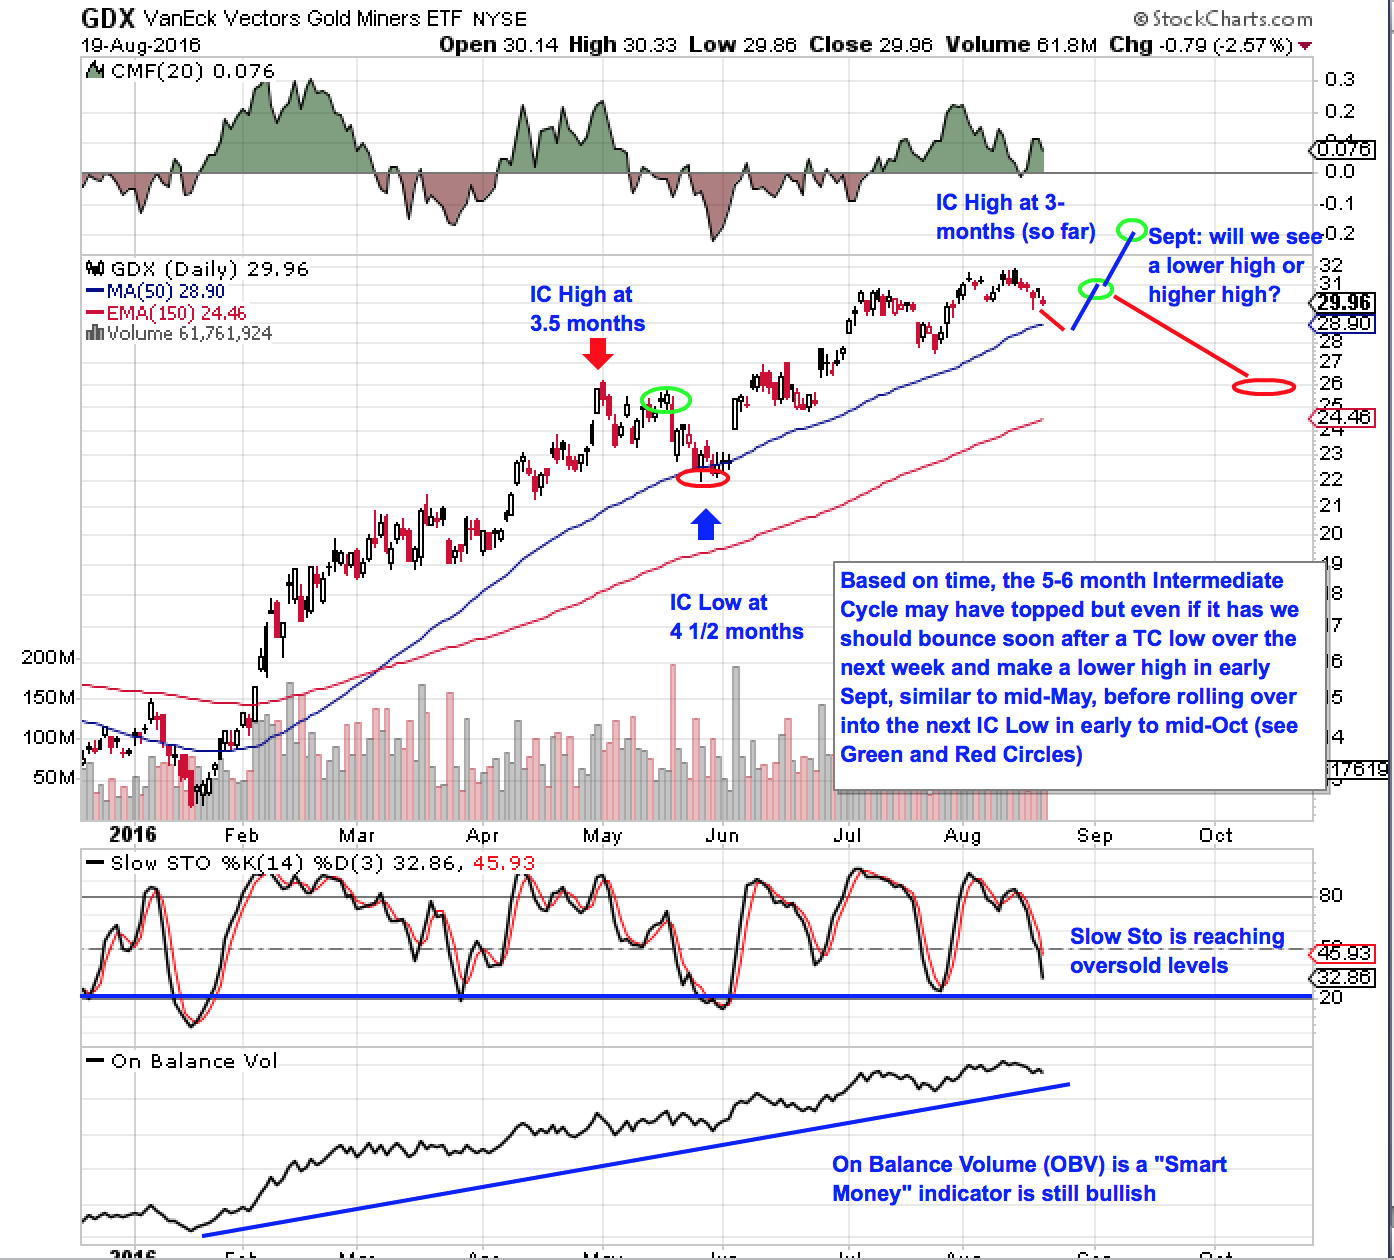
In my second chart, I show how during the last IC they topped near 3.5 months an moved into an IC low over the next 3 weeks. The chart also shows two possible scenarios for the move into the next IC Low which will likely be in the October timeframe based on Time.
Capital preservation is the key–it has been a great run…other trades exist…
Hedge Mortimer Hedge
🙂
I will be more than hedging. I plan to be taking some chips off the table and rotating into other opportunities. 😉
Yes, soft commodities seems promising. I am watching crude palm oil.
Sometimes gold cycle band gets a little fuzzy. Is it 21-23 months, 13-14 months or halved further. However, watch the fibo retracement level how each subcycle may end; in a bull trend it hasn’t exceeded 38.2 before beginning new IC.
Matthew, Gold’s longer Cycles are:
1) It’s 5-6 month Intermediate Cycle (actually 20-25 weeks).
2) Yearly Cycle (two Intermediate Cycles in length
3) Approximately a 4 Year Cycle
All cycles are measured Low to Low. You can observe Gold’s 4 Year Cycle by viewing a weekly chart from late 1999 to today. I show it’s 4 year lows on: Late 1999, Spring of 2004, Fall 2008, Summer 2012, and Jan 2016