HUI Pong
Follow this chart
https://stockcharts.com/h-sc/ui?s=%24HUI&p=D&yr=0&mn=6&dy=0&id=p24794288323&a=458225691
We had a breakdown of the solid line but then negated= False breakdown
BUT we have had a breakdown of the dotted Horizontal line with a back test
So Duelling lines and a ping pong move between them …just to confuse you
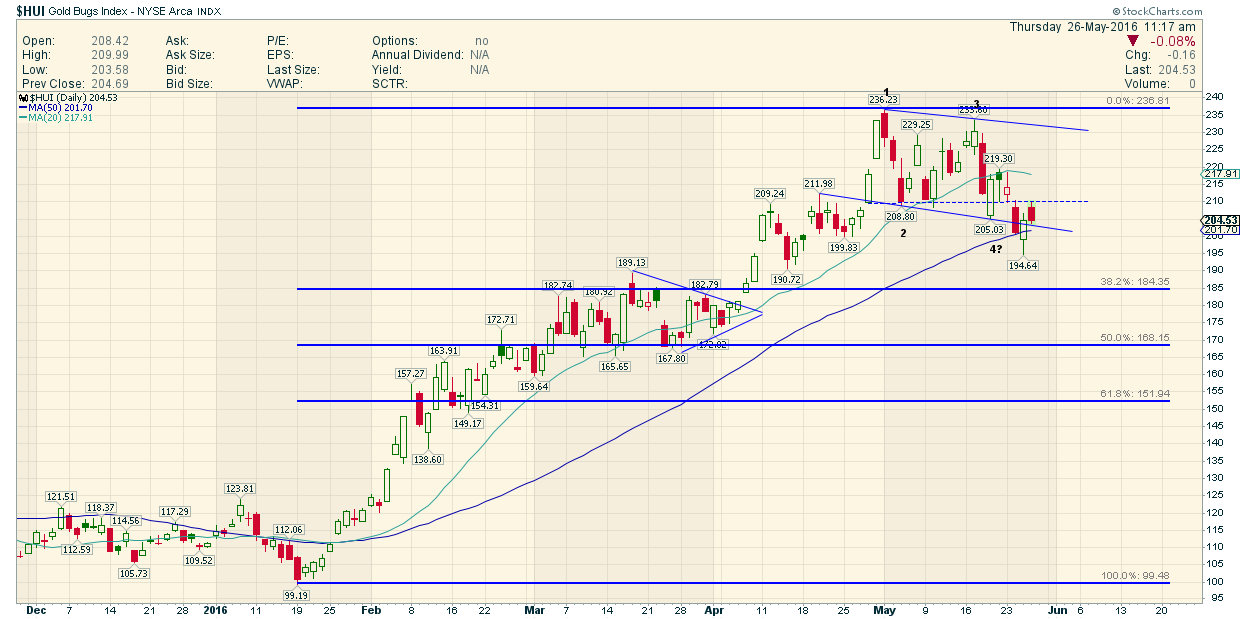
IF the Real pattern was the bottom solid line…this could be a false breakdown and you all know by now how those usually play out
IF the Horizontal dotted line is THE one…we have merely backtested it and could be in for some DOWN time to the first Fib support